Free Access
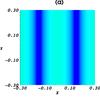
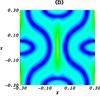
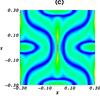
Fig. 2
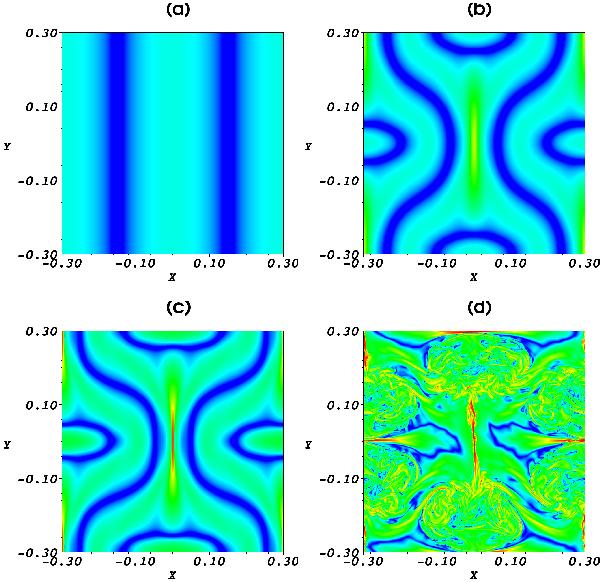
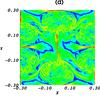
Contour plots of the logarithm of the current magnitude in the mid-plane, z = 0, for normalised times 0, 5, 7 and 10 (a)–d), respectively) for the experiment using driver 1, η = 0 and with a grid resolution of 5123. Red corresponds to a maximum of 400 while blue corresponds to a minimum value of 1.
This figure is made of several images, please see below:
Current usage metrics show cumulative count of Article Views (full-text article views including HTML views, PDF and ePub downloads, according to the available data) and Abstracts Views on Vision4Press platform.
Data correspond to usage on the plateform after 2015. The current usage metrics is available 48-96 hours after online publication and is updated daily on week days.
Initial download of the metrics may take a while.