Fig. 17

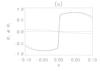
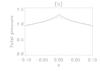
a) Normal (B⊥) and tangential (B∥) components of B across and along the current layer are plotted in the z = 0-plane (solid lines) and the z = 0.2-plane (dashed lines). Obviously, the components that show a sudden switch in sign are the B⊥ components. b) Total pressure perpendicular to the current layer in the z = 0-plane (solid line) and the z = 0.2-plane (dashed line). These are taken at t = 7 for the experiment using driver 1, η = 0 and 5123 resolution.
Current usage metrics show cumulative count of Article Views (full-text article views including HTML views, PDF and ePub downloads, according to the available data) and Abstracts Views on Vision4Press platform.
Data correspond to usage on the plateform after 2015. The current usage metrics is available 48-96 hours after online publication and is updated daily on week days.
Initial download of the metrics may take a while.