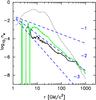
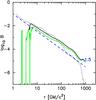
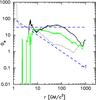
Fig. 2
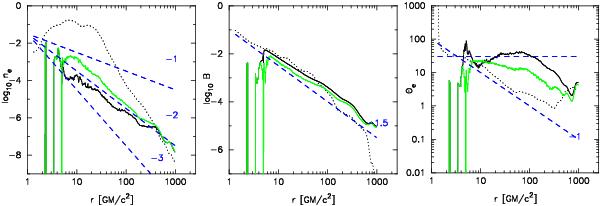
Time- and θ-angle-averaged (see Eq. (1)) profiles of ne, B, and Θe = kTe/mec2 (assuming Tp/Te = 1) in the jet and in the disk. The dotted lines correspond to the quantities measured in the turbulent accretion flow, and the solid lines are the averaged profiles of quantities measured in the jet region. The solid green lines are the profiles measured in the jet without the empty jet spine (i.e. excluding zones where B2/ρ0 > 0.1). The plasma density and magnetic-field strength are shown in the numerical code units.
Current usage metrics show cumulative count of Article Views (full-text article views including HTML views, PDF and ePub downloads, according to the available data) and Abstracts Views on Vision4Press platform.
Data correspond to usage on the plateform after 2015. The current usage metrics is available 48-96 hours after online publication and is updated daily on week days.
Initial download of the metrics may take a while.