Fig. 3
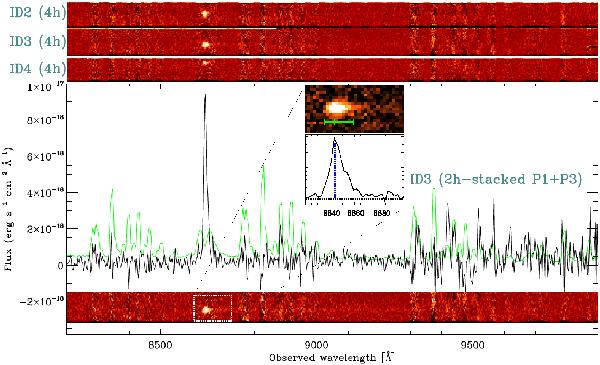
VIMOS 1D spectrum of ID3 (2h-exposure, pointing P1+P3; black line) and of the sky rescaled to arbitrary units (green line). The lower inset shows the sum of the 2D spectra ( h exposure, P1+P3). The 4h-stacked 2D spectra of each multiple image (ID2, ID3, and ID4) are shown in the insets on the top. A zoomed version of the 1D and 2D spectra around the Ly is shown in the central inset. The vertical blue dotted line marks the position of the peak of the line, which shows a clearly asymmetric profile. In the 2D spectrum, the green segments mark the position of the peak of the flux and that of the 20% flux level.
Current usage metrics show cumulative count of Article Views (full-text article views including HTML views, PDF and ePub downloads, according to the available data) and Abstracts Views on Vision4Press platform.
Data correspond to usage on the plateform after 2015. The current usage metrics is available 48-96 hours after online publication and is updated daily on week days.
Initial download of the metrics may take a while.