Fig. 2
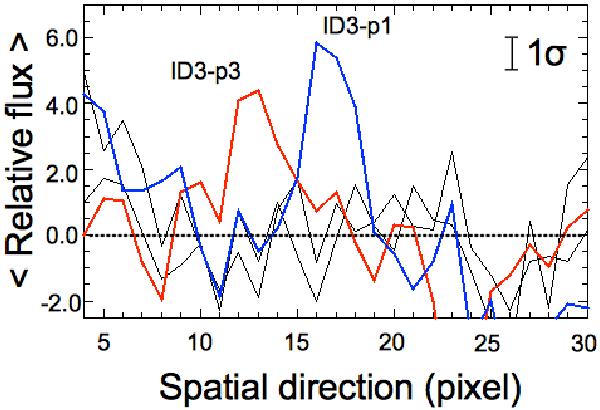
Spatial profiles along the direction of the slit for the spectra of ID3, derived by collapsing counts in the dispersion direction between and for each pointing separately. P1 is plotted in blue, P3 in red, and P2 and P4 in black. The continuum is clearly detected in P1 (5) and P3 (3). Spectra are generally at slightly different pixel positions in different pointings.
Current usage metrics show cumulative count of Article Views (full-text article views including HTML views, PDF and ePub downloads, according to the available data) and Abstracts Views on Vision4Press platform.
Data correspond to usage on the plateform after 2015. The current usage metrics is available 48-96 hours after online publication and is updated daily on week days.
Initial download of the metrics may take a while.