| Issue |
A&A
Volume 559, November 2013
|
|
|---|---|---|
| Article Number | A58 | |
| Number of page(s) | 16 | |
| Section | Extragalactic astronomy | |
| DOI | https://doi.org/10.1051/0004-6361/201322611 | |
| Published online | 13 November 2013 | |
BL Lacertae identifications in a ROSAT-selected sample of Fermi unidentified objects⋆,⋆⋆
1
INAF – Istituto di Astrofisica Spaziale e Fisica Cosmica di Bologna, via
Gobetti 101,
40129
Bologna,
Italy
e-mail:
This email address is being protected from spambots. You need JavaScript enabled to view it.
2
Department of Astronomy and Astrophysics, Pennsylvania State
University, University
Park, PA
16802,
USA
3
INAF – Istituto di Astrofisica e Planetologia Spaziali, via Fosso
del Cavaliere 100, 00133
Rome,
Italy
4
Instituto de Astronomía, Universidad Nacional Autónoma de Mexico,
Apartado Postal
70-264, 04510
Mexico D.F.,
Mexico
5
Instituto Nacional de Astrofísica, Óptica y Electrónica, Apartado Postal 51-216,
72000
Puebla,
Mexico
6 Research School of Astronomy and Astrophysics, Australian
National University, Canberra ACT-2611, Australia
7
Instituto de Astrofísica, Pontificia Universidad Católica de
Chile, Casilla 306,
Santiago 22,
Chile
8 Specola Vaticana, 00120 Città del Vaticano
9
Dipartimento di Fisica ed Astronomia “G. Galilei”, Università di
Padova, Vicolo dell’Osservatorio
3, 35122
Padua,
Italy
10
INAF – Osservatorio Astronomico di Padova, Vicolo
dell’Osservatorio 5, 35122
Padua,
Italy
Received: 5 September 2013
Accepted: 23 September 2013
Abstract
The optical spectroscopic followup of 27 sources belonging to a sample of 30 high-energy objects selected by positionally cross correlating the first Fermi/LAT Catalog and the ROSAT All-Sky Survey Bright Source Catalog is presented here. It has been found or confirmed that 25 of them are BL Lacertae objects (BL Lacs), while the remaining two are Galactic cataclysmic variables (CVs). This strongly suggests that the sources in the first group are responsible for the GeV emission detected with Fermi, while the two CVs most likely represent spurious associations. We thus find an 80% a posteriori probability that the sources selected by matching GeV and X-ray catalogs belong to the BL Lac class. We also show suggestions that the BL Lacs selected with this approach are probably high-synchrotron-peaked sources and in turn good candidates for the detection of ultra-high-energy (TeV) photons from them.
Key words: gamma rays: galaxies / BL Lacertae objects: general / novae, cataclysmic variables / techniques: spectroscopic
Based on observations collected at the following telescopes: Telescopio Nazionale Galileo of the Observatorio del Roque de los Muchachos of the Instituto de Astrofísica de Canarias (Canary Islands, Spain); New Technology Telescope of the European Southern Observatory (ESO) in Cerro La Silla (Chile), under program 89.A-0148(A); Unit 2 “Kueyen” of the Very Large Telescope of the ESO in Cerro Paranal (Chile), under program 71.D-0176(A); 1.5-m telescope of the Cerro Tololo Interamerican Observatory (Chile).
Tables 1–3 and Figs. 2–6 are available in electronic form at http://www.aanda.org
© ESO, 2013
1. Introduction
Until the end of the first decade of the present century the only available survey of the γ-ray sky was the one performed by EGRET (Hartman et al. 1999; Casandjian & Grenier 2008). One of the main problems with this survey is that about half of the detected high-energy sources (170 out of 271 in Hartman et al. 1999, and 87 out of 188 in Casandjian & Grenier 2008) could not be associated with longer-wavelength objects. This was mainly due to the large error boxes of these objects (with sizes of tens of arcminutes or more) which did not help in pinpointing their actual counterparts.
Therefore, one of the main objectives of the Fermi mission (McEnery et al. 2012), launched on June 2008 is the survey of the whole sky at γ-ray energies in the MeV-GeV range making use of the large collecting area and field of view of its instruments. In particular, the Large Area Telescope (LAT; Atwood et al. 2009) allows the emission of γ-ray objects to be detected in the 0.1–100 GeV band and permits their localization with an accuracy of a few arcminutes, depending on the significance and the spectral hardness with which the sources are detected.
After a preliminary issue of a list of bright γ-ray objects (Abdo et al. 2009), two catalogs of Fermi/LAT sources have been published by Abdo et al. (2010a) and Nolan et al. (2012) by accumulating 11 and 24 months of LAT observations, respectively. In the first, 1451 objects are present, 821 of which are associated with known sources at other wavelengths (Abdo et al. 2010a). In the second LAT catalog, Nolan et al. (2012) reported 1873 γ-ray sources, with 1297 of them identified with certainty or probably associated with counterparts of γ-ray producing source classes.
From the analysis of the position and the γ-ray timing and spectral behavior of the sources in these two surveys it is found that most of them are associated with extragalactic objects including blazars, flat spectrum radio quasars and/or BL Lacertae objects (BL Lacs), or with Galactic sources such as pulsars, pulsar wind nebulae, supernova remnants (SNRs), globular clusters, and a few γ-ray binaries. Some peculiar objects are also found, but their association is less firm. No tentative or credible counterpart is, however, found for a number of these cataloged γ-ray sources, which amount to ~30–40% depending on the chosen catalog.
The identification of these objects is nevertheless crucial for several investigations. In particular, the detection of high-energy blazars is of paramount importance to determine, for instance, a more accurate measurement of the imprint of the extragalactic background light in their γ-ray spectra (e.g., Ackermann et al. 2012a) and to improve the estimate of the blazar contribution to the extragalactic γ-ray background (e.g., Abdo et al. 2010b). In addition, having information about these unidentified γ-ray sources can give tight constraints on dark matter models (e.g., Zechlin et al. 2012; Massaro et al. 2013a).
The main issue to tackle for the identification of the nature of these objects is, again, the relatively large error box size of LAT sources (a few arcminutes in radius at least). Several approaches to attack this problem on both statistical grounds (e.g., Munar-Adrover et al. 2011; Ackermann et al. 2012b; D’Abrusco et al. 2013) and observational grounds (e.g., Mirabal & Halpern 2009; Shaw et al. 2012, 2013) were applied in recent years.
In particular, Stephen et al. (2010) tried a mixed statistical-observational approach by cross-correlating the positions of the first Fermi/LAT Catalog with those in the ROSAT All-Sky Survey Bright Source Catalog (Voges et al. 1999), which mapped the soft X-ray sky in the 0.1–2.4 keV range. The authors found a strong level of positional correlation between unassociated Fermi/LAT sources and ROSAT cataloged objects, leading to evidence for the association of a number of γ-ray sources with a soft X-ray counterpart, better positions (down to a few arcseconds) for all correlated objects, and hence the possibility of follow-up work at longer wavelengths, especially in optical.
In detail, Stephen et al. (2010) found 30 secure Fermi-ROSAT associations which allowed a likely optical counterpart to be pinpointed for nearly all of them. They also gave a tentative determination of the nature of these sources on the basis of their archival multiwavelength properties, finding that most associations (25 out of 30) are with blazar candidates, while only two are associated with Galactic objects (a SNR and a γ-ray binary with a low–mass companion star).
In order to complete this exploratory work which merges the γ-ray knowledge with the soft X-ray knowledge we decided to extend this information by performing an optical spectroscopy follow-up campaign on the targets with unidentified or tentatively proposed nature which were selected through the procedure of Stephen et al. (2010).
The present paper is structured as follows. In Sect. 2 we outline the sample of the selected sources and the additional techniques we used to refine their localization. In Sect. 3 a description of the observations is given. Section 4 presents the results, and a discussion about them is given in Sect. 5; the conclusions are shown in Sect. 6.
2. The selected sample
By considering the 30 objects listed in Table 1 of Stephen et al. (2010), we first performed a preliminary check to verify that the sources are recovered in the 2nd Fermi/LAT Catalog (Nolan et al. 2012); we determined that this is indeed true for all objects.
Next we took into account those sources in Stephen et al. (2010) with no identified nature or with identifications that had not yet been confirmed at the time of the publication of that work (October 2010). Thus, 1FGL J1910.9+0906 (associated with the SNR G043.3−00.2; Mezger et al. 1967) was not considered, nor was 1FGL J1227.9−4852 (the possible γ-ray counterpart of the atypical low-mass X-ray binary XSS J12270−4859; de Martino et al. 2010, 2013), along with the confirmed BL Lacs 1FGL J1353.6−6640 and 1FGL J1942.7+1033 (both observed with the ESO 8-m Unit 2 “Kueyen” of the Very Large Telescope by Tsarevsky et al. 2005).
On the other hand, we kept in our selection the objects 1FGL J0131.2+6121 and 1FGL J0137.8+5814 because, even if they were already spectroscopically identified as BL Lacs by Martí et al. (2004) and Bikmaev et al. (2008), respectively, their published spectra had relatively poor signal-to-noise ratios (S/N); so, we considered these sources as well in order to acquire spectroscopic data with higher quality. Thus 26 objects out of 30 in the original sample of Stephen et al. (2010) passed this check.
We then used the information gathered from radio catalogs such as those compiled with the NRAO VLA Sky Survey (NVSS; Condon et al. 1998), the Sydney University Molonglo Sky Survey (SUMSS; Mauch et al. 2003), and the Molonglo Galactic Plane Survey (MGPS; Murphy et al. 2007) to further reduce the ROSAT X-ray position uncertainty down to less than 2′′ and so to determine the actual optical counterpart with a higher degree of accuracy. In parallel, to confirm the presence of X-ray emission from the position of the ROSAT sources, we browsed the Swift/XRT archive1 (see also Landi et al. 2010 for 1FGL J2056.7+4938/IGR J20569+4940) or, in the case of 1FGL J0137.8+5814, the XMM-Newton Serendipitous Source Catalog (Watson et al. 2009). In all cases we could confirm the soft X-ray emission detected with ROSAT and pinpoint a putative optical counterpart; moreover, for 24 objects, the additional presence of a positionally coincident radio source allowed the association of a single optical object beyond any reasonable doubt.
Concerning the above, we would like to spend a word about the case of 1FGL J0841.4−3558. Stephen et al. (2010) associated this source with the F-type bright star HD 74208 (=HIP 42640), with magnitude V = 7.91 (Høg et al. 2000). In addition to the ROSAT source, in the XRT data we found another soft X-ray object located about 13 north of it: this object is detected above 3 keV and at radio frequencies, whereas the one associated with star HD 74208 is not. Although this strongly suggests that the former, harder X-ray emitter is the actual counterpart of 1FGL J0841.4−3558, for the sake of completeness we decided to perform spectroscopy on both optical sources associated with these two X-ray objects detected with Swift/XRT.
Unfortunately, the faintness (i′ = 19.5 mag; Martí et al. 2012) of the optical counterpart of source 1FGL J2056.7+4938 as well as its closeness to the very bright star (V = 8.82; Høg et al. 2000) BD+49 3420 prevented us from obtaining meaningful optical spectroscopy of it. In the end, we acquired optical spectroscopy on the selected putative counterparts of the sources listed in Table 1.
Given that all objects in Table 1 have R-band magnitudes mostly in the 16÷18 range according to the US Naval Observatory (USNO) catalogs (Monet et al. 2003; see also Table 2), we opted to perform optical spectroscopic observations with medium-sized (4-m class) telescopes; only in the case of the bright star HD 74208 did we use a smaller, 1.5-m telescope (this observation is not reported in Table 1; see next section for details).
To complete the information about the Fermi-ROSAT sample of Stephen et al. (2010), we also retrieved from the ESO data archive2 the relevant files concerning optical spectroscopy of the counterparts of sources 1FGL J1353.6−6640 and 1FGL J1942.7+1033 (also in this case, these two objects are not reported in Table 1; we refer the reader to Tsarevsky et al. 2005, for details about the corresponding observational setup) and reduced them independently. In total we analyzed the spectra of 28 optical objects connected with 27 Fermi-ROSAT associations from Stephen et al. (2010).
3. Optical observations and data analysis
Optical spectroscopy of sources accessible from the northern hemisphere (i.e., with declination ≳−30°, with the single exception of 1FGL J1643.5−0646) was acquired with the 3.58-m Telescopio Nazionale Galileo (TNG) located at La Palma, Canary Islands (Spain). Its imaging spectrograph DOLoReS carried a 2048 × 2048 pixel E2V 4240 CCD; the spectra were acquired with the LR-B grism and a 1 5-wide slit, which secured a nominal spectral coverage in the 3500–8200 Å range and a dispersion of 2.5 Å/pixel. The TNG data were acquired between February 2011 and March 2012.
We then acquired spectra of the southernmost objects (with declination below −30°) plus 1FGL J1643.5−0646 again using a 3.58-m telescope, the ESO New Technology Telescope (NTT) of the La Silla Observatory (Chile) equipped with the EFOSC2 instrument. Spectroscopic data were obtained with a 2048 × 2048 pixel Loral/Lesser CCD. Grism #13 and slits of width between 1′′ and 2′′ (depending on the night seeing) were used; this guaranteed a 3700–9300 Å nominal spectral coverage and a dispersion of 2.8 Å/pixel. The data were acquired in September and October 2012.
Table 1 reports the log of these observations along with the coordinates of the observed optical sources, extracted from the Two Micron All Sky Survey (2MASS, with a positional uncertainty of ≤01: Skrutskie et al. 2006) or the USNO catalogs (with accuracies of about 02: Deutsch 1999; Assafin et al. 2001; Monet et al. 2003).
As mentioned in the previous section, for the sake of completeness we also obtained spectroscopy of star HD 74208 with the 1.5-m CTIO telescope of Cerro Tololo (Chile) equipped with the R-C spectrograph, which carries a 1274 × 280 pixel Loral CCD. Two 60 s spectroscopic frames were secured on 6 February 2012, with start times at 02:10 and 02:12 UT, respectively. Data were secured using Grating #13/I and with a slit width of 15, giving a nominal spectral coverage between 3300 and 10 500 Å and a dispersion of 5.7 Å/pixel.
The whole set of spectroscopic data acquired at these telescopes, as well as the data from the ESO archive, was optimally extracted (Horne 1986) and reduced following standard procedures using IRAF3. Calibration frames (flat fields and bias) were taken on the day preceding or following the observing night. The wavelength calibration was performed using lamp data acquired soon after each on-target spectroscopic acquisiton; the uncertainty in this calibration was ~0.5 Å in all cases according to our checks made using the positions of background night sky lines. Flux calibration was obtained using cataloged spectrophotometric standards. Finally, when multiple spectra were acquired from a given object, the data were stacked together to increase the S/N.
Furthermore, given that all the considered objects except the putative counterpart of 1FGL J1823.5−3454 have an optical R-band magnitude tabulated in the USNO-A2.04 catalog (see also Table 2), we used the R-band acquisition image corresponding to the spectroscopic observation of this source to obtain the relevant photometric information. The image was acquired with NTT plus EFOSC2 in imaging mode, which covers a field of 41 × 41 with a scale of 012 pix-1. The measurement was performed using simple aperture photometry, and calibrated using field stars with cataloged USNO-A2.0 R-band magnitudes.
4. Results
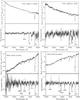 |
Fig. 1 Spectra of the optical counterparts of four BL Lacs in our sample. For each panel, the upper box reports the observed spectrum not corrected for the intervening Galactic absorption, while the lower one shows the same spectrum normalized to its continuum. The main spectral features are labeled in the lower panels, with the intervening Galactic features indicated in the lower part of the box and (if present) the features allowing the redshift measurement marked in the above part of it. The symbol ⊕ indicates atmospheric telluric absorption bands. The TNG spectra have been smoothed using a Gaussian filter with σ = 3 Å. |
Our optical spectroscopy shows that almost all of the sources (23 cases; Figs. 1–6) in our sample are BL Lac-type active galactic nuclei (AGNs). Their spectra are mainly characterized by a nearly featureless and power law shaped continuum (see, e.g., Laurent-Muehleisen et al. 1998; see also Sect. 5), with the sole exception of 1FGL J2042.2+2427 (lower-right panel of Fig. 5). This makes the determination of absorption and/or emission lines difficult, as the contribution of the host galaxy to the total light is often overwhelmed by that of the AGN jet pointing towards the observer, as expected in BL Lacs.
Because of this, we also present in Figs. 1–6 the spectra normalized to the continuum; this is done to enhance the spectral contrast and to make the search for spectral features easier. We could determine the redshift for four objects through the identification of multiple features, whereas for four more BL Lacs we give a tentative redshift by means of the identification of a single absorption feature (either Hα or Caii; see Table 3). In six out of these eight cases we cannot exclude that the observed absorption lines are produced by an intervening system because of the discrepancy with the lower limit of the object redshift in Table 2 (see below), as well as with those computed by Shaw et al. (2013). We note, however, that the measured redshifts of 1FGL J1643.5−0646 and 1FGL J2042.2+2427 are actually smaller than the corresponding lower limits set by Shaw et al. (2013).
In two cases (1FGL J0838.6−2828 and 1FGL J1544.5−1127) we identified the ROSAT sources found by Stephen et al. (2010) within the Fermi error ellipse as Galactic cataclysmic variables (CVs). A thorough description of the results concerning these two sources is given in the Appendix.
We also report that the optical spectrum of the bright star HD 74208 associated with the ROSAT source 1RXS J084121.4−355704, i.e., the softer of the two X-ray objects detected by Swift/XRT within the error box of 1FGL J0841.4−3558 (see Sect. 2), is indeed typical of an F-type star with no peculiarities. Therefore we will not discuss this object further and we will assume that the correct counterpart of 1FGL J0841.4−3558 is, also in this case, a BL Lac AGN (Fig. 3, upper-left panel).
It is worth noting that our results concerning 1FGL J0648.8+1516 (in Table 3) are consistent with those of Aliu et al. (2011); moreover, eight of the BL Lac objects in our sample (indicated with an asterisk in Table 2) are also present in the large sample of BL Lac spectra published by Shaw et al. (2013).
Finally, for all BL Lac objects listed in Table 2 (including 1FGL J1353.6−6640 and 1FGL J1942.7+1033) we applied the method of Sbarufatti et al. (2006; see also Sbarufatti et al. 2009) to determine a lower limit for the source redshift and the optical continuum power law spectral slope α; this is possible through the use of the value of the minimum equivalent width (EW) for an absorption line that can be detected in the available optical spectrum of the source itself. This approach can be performed through the equation 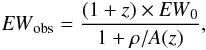 (1)where EWobs is the observed EW of an absorption line, EW0 its intrinsic value, z the source redshift, ρ the nucleus-to-host flux ratio, and A(z) a correction term that takes into account the loss of light inside the observed slit aperture. The results of this method are also listed in Table 2, together with the results of the photometry of the optical counterpart of 1FGL J1823.5−3454; the uncertainty on the latter measurement can be estimated as ±0.3 mag, which is the systematic error on the USNO magnitude calibration (Monet et al. 2003), given that the statistical error of our photometry on this source is negligible compared to the systematic error of the USNO stars used as calibrators. Comparing our results of Table 2 with those of Shaw et al. (2013) for the objects belonging to both samples, we see that our lower limit for the redshift of a given object is in general lower than that of those authors.
5. Discussion
Stephen et al. (2010) suggested that the Fermi-ROSAT sample of possible BL Lac objects they selected may be made of objects with a very energetic electron distribution, such that the synchrotron emission peak of their spectral energy distribution (SED) falls in the ultraviolet band or in the soft X-rays. Thus, they may be high-synchrotron-peaked BL Lac (HBL) objects, and they could in principle be detectable up to the TeV bands (Padovani & Giommi 1995; Fossati et al. 1998). Moreover, Shaw et al. (2013) classify as HBL the eight sources in common with our sample, again on the basis of their broadband SEDs. This inference is also supported by the relatively hard γ-ray photon spectral index shown by most BL Lac objects in the present sample (Γ ≲ 2; see Table 2 of Stephen et al. 2010).
In order to check and verify this assertion, we applied the method described in Abdo et al. (2010c,d) for the SED classification and the determination of the frequency of the synchrotron peak for all the BL Lacs in our sample. This can be made by computing the broadband spectral indices αro and αox between the radio and optical (5 GHz and 5000 Å) and optical and X-ray (5000 Å and 1 keV) bands, respectively.
To this aim, we used the ROSAT X-ray fluxes reported in Stephen et al. (2010); we corrected them for the Galactic absorption according to the maps of Kalberla et al. (2005); and we assumed an X-ray power law spectral shape with photon index Γ = 2.23 (Brinkmann et al. 1997). For the optical, we used the R-band magnitudes in Table 2; we corrected them for the intervening Galactic absorption using the maps of Schlegel et al. (1998) and the reddening law of Cardelli et al. (1989), together with the total-to-selective extinction ratio of Rieke & Lebofsky (1985); we then determined the corresponding optical fluxes using the conversion factor of Fukugita et al. (1995) and we rescaled the values at 5000 Å assuming a power law spectral shape F(λ) = λα with α = −0.7 (Falomo et al. 1993) for the optical continuum. We note that the choice of this average value rather than those given in Table 2 does not substantially alter our results; one can see that a variation of ±0.3 in α corresponds to a change of less than 2% in both αro and αox. Finally, we used the radio flux densities compiled in Stephen et al. (2010) and assumed a flat radio spectral shape (e.g., Begelman et al. 1984) to rescale them at 5 GHz.
The results for our sample of BL Lacs are graphically shown in Fig. 7, modeled following Fig. 4 of Abdo et al. (2010c): all objects fall below the thick broken line. This indicates that the frequency of their synchrotron peak, computed following Sect. 3.3.2 of Abdo et al. (2010c) and shown in Table 2, is above 1014 Hz in all cases, thus they are at least intermediate-synchrotron-peaked BL Lac (IBL) objects. Moreover, 18 of them have synchrotron peak frequency larger than 1015 Hz (for 1FGL J0848.6+0504 this value is >1016 Hz) and thus can be classified as HBLs. One of the sources in our sample, 1FGL J0648.8+1516, has been detected up to the TeV range (Aliu et al. 2011); it is also among the ones with the largest synchrotron peak frequency within those studied in this paper (see the last column of Table 2).
This supports and extends the suggestion of Stephen et al. (2010) that this selection obtained by cross-correlating the Fermi and the ROSAT catalogs allowed pinpointing preferentially high-energy BL Lacs. Also, this partially agrees with what Shaw et al. (2013) find for the objects in common with our sample, because we classify 1FGL J1553.5−3116, 1FGL J1643.5−0646, and 1FGL J2146.6−1345 as IBLs rather than HBLs. However, given the approximations we introduced in our computations, we can nevertheless conclude that our results are compatible with those of Shaw et al. (2013).
It should also be noted that the recent catalog of Fermi/LAT sources detected above 10 GeV (1FHL; Ackermann et al. 2013) contains 20 out of the 25 sources listed in Table 2 (the exceptions are 1FGL J0223.0−1118, 1FGL J0848.6+0504, 1FGL J1643.5−0646, 1FGL J1933.3+0723, and 1FGL J2323.0−4919). Eighteen of them are indeed associated by Ackermann et al. (2013; their Table 3) with the corresponding BL Lac objects considered in the present paper, while just two (1FGL J0841.4−3558 and 1FGL J1353.6−6640) appear unassociated with any longer-wavelength source. This connection can be considered an additional clue about the possibility of detecting TeV emission from the majority of these BL Lacs.
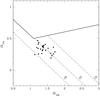 |
Fig. 7 Positions of the BL Lacs listed in Table 2 on the αox–αro plane. The thick solid line indicates the region described in Sect. 3.3.2 of Abdo et al. (2010c). The dashed lines correspond to the loci in which the synchrotron peak frequency is 1014, 1015, and 1016 Hz. |
A further indication of the possible TeV nature of the BL Lac objects in the sample of Stephen et al. (2010) comes from the treatment of Massaro et al. (2013b). These authors, by means of their method (D’Abrusco et al. 2013; Massaro et al. 2012, 2013a) of selecting BL Lac candidates among the unidentified Fermi sources using the WISE mid-infrared (MIR) magnitudes (Wright et al. 2010) of putative candidates, identified the MIR characteristics of a sample of possible TeV BL Lac objects. Massaro et al. 2013b) thereby determined a locus in the so-called blazar strip in which these possible TeV-emitting BL Lac objects are found in the WISE [4.6]–[12]/[3.4]–[4.6] color–color diagram (see Fig. 8).
When we consider the WISE colors of the objects in the sample of Stephen et al. (2010), we see that all objects we identify here as BL Lacs fall along the blazar strip and, most importantly, nearly all of them are within the limits of this locus of TeV-emitting BL Lacs. The only exception is 1FGL J2042.2+2427, which nevertheless lies close to the blue end of the strip (in the lower-left part of Fig. 8), thus perhaps indicating a prolongation of it to bluer colors and possibly an even more extreme BL Lac nature for this source.
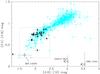 |
Fig. 8 The [4.6]–[12]/[3.4]–[4.6] MIR color–color plot reporting the positions of γ-ray emitting blazars (in cyan) associated with WISE sources forming the blazar strip (see Massaro et al. 2013a, for more details), together with the BL Lac objects (filled squares) identified in this paper and belonging to the Fermi-ROSAT sample of Stephen et al. (2010). In the diagram, the positions of non-blazar sources in the list of Stephen et al. (2010) are labeled and indicated with open circles. The dashed box indicates the locus of the WISE blazar strip considered by Massaro et al. (2013b) as containing likely TeV-emitting BL Lacs. |
We would like to point out here some necessary caveats concerning the application of this X-ray/GeV selection method. Although 25 out of 30 sources of our Fermi-ROSAT sample are confirmed BL Lac sources (see Table 2), we see from the Appendix of this paper and from Stephen et al. (2010) that four objects are within the Galaxy, namely one SNR (G043.3−00.2), one LMXB (XSS J12270−4859), and two CVs (1RXS J083842.1−282723 and 1RXS J154439.4−112820, putatively associated with 1FGL J0838.6−2828 and 1FGL J1544.5−1127, respectively), while one source (1FGL J2056.7+4938) is still unidentified. We can thus state that the a posteriori probability of success in pinpointing BL Lac-type objects using the approach of Stephen et al. (2010) is on the order of 80%. We remark that none of these five sources except 1FGL J1910.9+0906 is present in the 1FHL catalog of Ackermann et al. (2013).
We also stress that the two CVs detected here are unlikely to be physically associated with the Fermi sources 1FGL J0838.6−2828 and 1FGL J1544.5−1127; while it is known that accreting white dwarfs may produce outbursts of γ-rays (see Cheung 2013 for a review and Hays et al. 2013 for the most recent case), these are associated with powerful transient phenomena such as nova eruptions rather than with persistently emitting X-ray CVs. Possible TeV emission from some magnetic CVs was announced in the past (Bhat et al. 1991; Bowden et al. 1992; Meintjes et al. 1992), but was never confirmed by subsequent deeper observations (Lang et al. 1998; Sidro et al. 2008; López-Coto et al. 2013). Indeed, models describing production of γ-ray emission from magnetic CVs have been developed (e.g., Schlegel et al. 1995, and references therein; Bednarek & Pabich 2011), but they can hardly be applied to the two cases in our sample as they do not appear to host a white dwarf with a strong magnetic field (see Appendix).
To corroborate on a statistical basis the lack of physical connection between the ROSAT and Fermi emissions in the case of the two CVs reported in the Appendix, we can consider the spatial density of CVs in the Galaxy from Rogel et al. (2008). We find that the number of CVs lying within 760 pc of the Earth (that is, the inferred distance of the farthest of the two CVs identified here; see Table A.1) and falling in a sky area of size equal to the sum of the error boxes of the 30 Fermi/LAT sources of Stephen et al. (2010; we conservatively assumed an average error circle of radius 6 arcmin) is about one. Given the uncertainties associated with the local Galactic CV density and the distance of the CVs reported in the Appendix, this value is fully compatible with our observational result, according to which we find two CVs among the sample considered in this paper. Because of all of the above, we deem these two putative associations in the list of Stephen et al. (2010) as spurious.
A possible way to identify “BL Lac impostors” before performing optical spectroscopy on a X-ray/GeV selected sample such as the present one is the combined use of WISE and radio data. Indeed, as one can see from Fig. 8, WISE observations indicate that all BL Lacs in our sample fall along the blazar strip of Massaro et al. (2012, 2013a), with 1RXS J154439.4−112820 and 1FGL J1910.9+0906 lying well outside of it; 1RXS J083842.1−282723 and 1FGL J2056.7+4938 are not detected with WISE, the latter possibly because of source confusion introduced by the nearby bright star BD+49 3420 (see Sect. 2). The only apparent outlier is 1FGL J1227.9−4852, which falls both along the blazar strip and in the TeV box shown in Fig. 8; however, it can be discarded a priori as a blazar candidate because it was not detected in any of the main radio surveys (although deep radio observations revealed a faint emission from this source; see Hill et al. 2013). Thus, although the WISE TeV box could contain a small number of false positives, the additional use of cataloged radio information can help us to remove them.
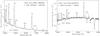 |
Fig. A.1 Spectra (not corrected for the intervening Galactic absorption) of the optical counterparts of the two CVs identified within the sample of ROSAT sources considered in this paper. For each spectrum, the main spectral features are labeled. The symbol ⊕ indicates atmospheric telluric absorption bands. |
Synoptic table containing the main results concerning the two CVs identified in the present sample of ROSAT sources.
6. Conclusions
The spectroscopic investigation of the putative optical counterparts of a sample of positionally correlated X-ray and γ-ray sources extracted from ROSAT and Fermi catalogs, respectively (Stephen et al. 2010), shows that 25 out of 30 are BL Lac-type AGNs. For eight of these objects we provide a redshift measurement, while for the remaining ones a lower limit to this observable is given. Two more sources are instead classified as Galactic CVs, and thus are quite likely spuriously associated with the GeV emission detected with Fermi. This suggests an 80% a posteriori probability of finding BL Lac objects by cross-correlating X-ray and γ-ray catalogs.
Our analysis also hints to the fact that the synchrotron peak of the SED of BL Lac objects selected with this approach falls in the higher-energy side of the spectral range observed for this type of source (i.e., between the far ultraviolet and the soft X-rays) which suggests that this kind of selection may unearth objects detectable at TeV energies with instruments foreseeable in the near future (e.g., the Čerenkov Telescope Array; Actis et al. 2011).
We conclude by pointing out that the interest in these extreme TeV blazars is driven by the possibility of obtaining information on both the acceleration processes of charged particles in relativistic flows (e.g., Ghisellini et al. 2010) and the intensity of the extragalactic background light, which reflects the time-integrated history of light production and re-processing in the universe (e.g., Domínguez et al. 2013); hence, its measurement can provide information on the history of cosmological star formation (Mankuzhiyil et al. 2010). This set of likely high-energy BL Lacs can thus be an initial sample to test the points mentioned above.
Online material
Log of the spectroscopic observations presented in this paper (see text for details).
Main optical spectroscopic information concerning BL Lac objects in our sample with detected redshifted spectral lines.
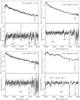 |
Fig. 2 The same as Fig. 1, but for four more spectra of BL Lacs in our sample. |
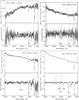 |
Fig. 3 The same as Fig. 1, but for four more spectra of BL Lacs in our sample. |
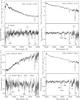 |
Fig. 4 The same as Fig. 1, but for four more spectra of BL Lacs in our sample. |
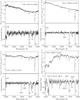 |
Fig. 5 The same as Fig. 1, but for four more spectra of BL Lacs in our sample. |
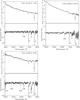 |
Fig. 6 The same as Fig. 1, but for three more spectra of BL Lacs in our sample. |
XRT archival data are freely available at http://www.asdc.asi.it/
IRAF is the Image Reduction and Analysis Facility made available to the astronomical community by the National Optical Astronomy Observatories, which are operated by AURA, Inc., under contract with the US National Science Foundation. It is available at http://iraf.noao.edu/
Available at: http://archive.eso.org/skycat/servers/usnoa
Acknowledgments
We thank Francesca Ghinassi and Avet Harutyunyan for Service Mode observations at the TNG; Duncan Castex and Ariel Sánchez for assistance at the ESO NTT; Manuel Hernández for Service Mode observations at the CTIO telescope and Fred Walter for coordinating them. N.M. thanks Ivo Saviane, Valentin Ivanov and Roberto Soria for help with data acquisition, Paola Grandi for useful discussions, and Francesco Massaro for help with the preparation of Fig. 8. We also thank the anonymous referee for useful remarks which helped us to improve the quality of this paper. This research has made use of the ASI Science Data Center Multimission Archive and of data obtained from the ESO Science Archive Facility; it also used the NASA Astrophysics Data System Abstract Service, the NASA/IPAC Extragalactic Database (NED), and the NASA/IPAC Infrared Science Archive, which are operated by the Jet Propulsion Laboratory, California Institute of Technology, under contract with the National Aeronautics and Space Administration. This publication made use of data products from the Two Micron All Sky Survey (2MASS), which is a joint project of the University of Massachusetts and the Infrared Processing and Analysis Center/California Institute of Technology, funded by the National Aeronautics and Space Administration and the National Science Foundation. This research has also made use of the SIMBAD and VIZIER databases operated at CDS, Strasbourg, France. N.M. thanks the Departamento de Astronomía y Astrofísica of the Pontificia Universidad Católica de Chile in Santiago for the warm hospitality during the preparation of this paper. P.P. and R.L. are supported by the ASI-INAF agreement No. I/033/10/0. D.M. is supported by the BASAL CATA PFB-06 and FONDECYT No. 1130196 grants. G.G. is supported by Fondecyt grant No. 1120195.
References
- Abdo, A. A., Ackermann, M., Ajello, M., et al. 2009, ApJS, 183, 46 [NASA ADS] [CrossRef] [Google Scholar]
- Abdo, A. A., Ackermann, M., Ajello, M., et al. 2010a, ApJS, 188, 405 [NASA ADS] [CrossRef] [Google Scholar]
- Abdo, A. A., Ackermann, M., Ajello, M., et al. 2010b, ApJ, 720, 435 [Google Scholar]
- Abdo, A. A., Ackermann, M., Ajello, M., et al. 2010c, ApJ, 715, 429 [NASA ADS] [CrossRef] [Google Scholar]
- Abdo, A. A., Ackermann, M., Ajello, M., et al. 2010d, ApJ, 716, 30 [NASA ADS] [CrossRef] [Google Scholar]
- Ackermann, M., Ajello, M., Allafort, A., et al. 2012a, Science, 338, 1190 [NASA ADS] [CrossRef] [Google Scholar]
- Ackermann, M., Ajello, M., Allafort, A., et al. 2012b, ApJ, 753, 83 [NASA ADS] [CrossRef] [Google Scholar]
- Ackermann, M., Ajello, M., Allafort, A., et al. 2013, ApJS, in press [arXiv:1306.6772] [Google Scholar]
- Actis, M., Agnetta, G., Aharonian, F., et al. 2011, Experim. Astron., 32, 193 [Google Scholar]
- Aliu, E., Aune, T., Beilicke, M., et al. 2011, ApJ, 742, 127 [NASA ADS] [CrossRef] [Google Scholar]
- Assafin, M., Andrei, A. H., Vieira Martins, R., et al. 2001, ApJ, 552, 380 [NASA ADS] [CrossRef] [Google Scholar]
- Atwood, W. B., Abdo, A. A., Ackermann, M., et al. 2009, ApJ, 697, 1071 [NASA ADS] [CrossRef] [Google Scholar]
- Bednarek, W., & Pabich, J. 2011, MNRAS, 411, 1701 [NASA ADS] [CrossRef] [Google Scholar]
- Begelman, M. C., Blandford, R. D., & Rees, M. J. 1984, Rev. Mod. Phys., 56, 255 [NASA ADS] [CrossRef] [Google Scholar]
- Bhat, C. L., Kaul, R. K., Rawat, H. S., et al. 1991, ApJ, 369, 475 [NASA ADS] [CrossRef] [Google Scholar]
- Bikmaev, I. F., Burenin, R. A., Revnivtsev, M. G., et al. 2008, Astron. Lett., 34, 653 [NASA ADS] [CrossRef] [Google Scholar]
- Bowden, C. C. G., Bradbury, S. M., Chadwick, P. M., et al. 1992, Astropart. Phys., 1, 47 [Google Scholar]
- Brinkmann, W., Siebert, J., Feigelson, E. D., et al. 1997, A&A, 323, 739 [NASA ADS] [Google Scholar]
- Cardelli, J. A., Clayton, G. C., & Mathis, J. S. 1989, ApJ, 345, 245 [NASA ADS] [CrossRef] [Google Scholar]
- Casandjian, J.-M., & Grenier, I. A. 2008, A&A, 489, 849 [NASA ADS] [CrossRef] [EDP Sciences] [Google Scholar]
- Cheung, C. C. 2013, Fermi Discovers a New Population of Gamma-ray Novae, in: proc. of 4th Fermi Symposium, eds. N. Omodei, T. Brandt, & C. Wilson-Hodge, eConf C121028 [arXiv:1304.3475] [Google Scholar]
- Condon, J. J., Cotton, W. D., Greisen, E. W., et al. 1998, AJ, 115, 1693 [NASA ADS] [CrossRef] [Google Scholar]
- D’Abrusco, R., Massaro, F., Paggi, A., et al. 2013, ApJS, 206, 12 [NASA ADS] [CrossRef] [Google Scholar]
- de Martino, D., Falanga, M., Bonnet-Bidaud, J.-M., et al. 2010, A&A, 515, A25 [NASA ADS] [CrossRef] [EDP Sciences] [Google Scholar]
- de Martino, D., Belloni, T., Falanga, M., et al. 2013, A&A, 550, A89 [NASA ADS] [CrossRef] [EDP Sciences] [Google Scholar]
- Deutsch, E. W. 1999, AJ, 118, 1882 [NASA ADS] [CrossRef] [Google Scholar]
- Domínguez, A., Finke, J. D., Prada, F., et al. 2013, ApJ, 770, 77 [NASA ADS] [CrossRef] [Google Scholar]
- Falomo, R., Bersanelli, M., Bouchet, P., & Tanzi, E. G. 1993, AJ, 106, 11 [NASA ADS] [CrossRef] [Google Scholar]
- Fossati, G., Maraschi, L., Celotti, A., Comastri, A., & Ghisellini, G. 1998, MNRAS, 299, 433 [NASA ADS] [CrossRef] [Google Scholar]
- Fukugita, M., Shimasaku, K., & Ichikawa, T. 1995, PASP, 107, 945 [NASA ADS] [CrossRef] [Google Scholar]
- Ghisellini, G., Tavecchio, F., Foschini, L., et al. 2010, MNRAS, 402, 497 [NASA ADS] [CrossRef] [Google Scholar]
- Hartman, R. C., Bertsch, D. L., Bloom, S. D., et al. 1999, ApJS, 123, 79 [NASA ADS] [CrossRef] [Google Scholar]
- Hays, E., Cheung, T., & Ciprini, S. 2013, ATel #5302 [Google Scholar]
- Hill, A. B., Szostek, A., Corbel, S., et al. 2011, MNRAS, 415, 235 [NASA ADS] [CrossRef] [Google Scholar]
- Høg, E., Fabricius, C., Makarov, V. V., et al. 2000, A&A, 355, L27 [NASA ADS] [Google Scholar]
- Horne, K. 1986, PASP, 98, 609 [NASA ADS] [CrossRef] [EDP Sciences] [Google Scholar]
- Kalberla, P. M. W., Burton, W. B., Hartmann, D., et al. 2005, A&A, 440, 775 [NASA ADS] [CrossRef] [EDP Sciences] [Google Scholar]
- Landi, R., Bassani, L., Malizia, A., et al. 2010, MNRAS, 403, 945 [Google Scholar]
- Lang, M. J., Buckley, J. H., Carter-Lewis, D. A., et al. 1998, Astropart. Phys., 9, 203 [Google Scholar]
- Laurent-Muehleisen, S. A., Kollgaard, R. I., Ciardullo, R., et al. 1998, ApJS, 118, 127 [NASA ADS] [CrossRef] [Google Scholar]
- López-Coto, R., Blanch Bigas, O., Cortina, J., et al. 2013, Search for TeV γ-ray emission from AE Aqr coincident with high optical and X-ray states with the MAGIC telescopes, in: Proc. 33rd International Cosmic Ray Conference, Brazilian J. Phys., in press [arXiv:1309.2503] [Google Scholar]
- Mankuzhiyil, N., Persic, M., & Tavecchio, F. 2010, ApJ, 715, L16 [NASA ADS] [CrossRef] [Google Scholar]
- Martí, J., Paredes, J. M., Bloom, J. S., et al. 2004, A&A, 413, 309 [NASA ADS] [CrossRef] [EDP Sciences] [Google Scholar]
- Martí, J., Luque-Escamilla, P. L., Sánchez-Ayaso, E., & Muñoz-Arjonilla, A. J. 2012, Ap. Space Sci., 340, 143 [NASA ADS] [CrossRef] [Google Scholar]
- Masetti, N., Parisi, P., Palazzi, E., et al. 2013, A&A, 556, A120 [NASA ADS] [CrossRef] [EDP Sciences] [Google Scholar]
- Massaro, F., D’Abrusco, R., Tosti, G., et al. 2012, ApJ, 750, 138 [NASA ADS] [CrossRef] [Google Scholar]
- Massaro, F., D’Abrusco, R., Paggi, A., et al. 2013a, ApJS, 206, 13 [NASA ADS] [CrossRef] [Google Scholar]
- Massaro, F., Paggi, A., Errando, M., et al. 2013b, ApJS, 207, 16 [NASA ADS] [CrossRef] [Google Scholar]
- Mauch, T., Murphy, T., Buttery, H. J., et al. 2003, MNRAS, 342, 1117 [NASA ADS] [CrossRef] [Google Scholar]
- McEnery, J. E., Michelson, P. F., Paciesas, W. S., & Ritz, S. 2012, Opt. Eng., 51, 011012 [NASA ADS] [CrossRef] [Google Scholar]
- Meintjes, P. J., Raubenheimer, B. C., de Jager, O. C., et al. 1992, ApJ, 401, 325 [NASA ADS] [CrossRef] [Google Scholar]
- Mezger, P. G., Schraml, J., & Terzian, Y. 1967, ApJ, 150, 807 [NASA ADS] [CrossRef] [Google Scholar]
- Mirabal, N., & Halpern, J. P. 2009, ApJ, 701, L129 [NASA ADS] [CrossRef] [Google Scholar]
- Monet, D. G., Levine, S. E., Canzian, B., et al. 2003, AJ, 125, 984 [NASA ADS] [CrossRef] [Google Scholar]
- Munar-Adrover, P., Paredes, J. M., & Romero, G. E. 2011, A&A, 530, A72 [NASA ADS] [CrossRef] [EDP Sciences] [Google Scholar]
- Murphy, T., Mauch, T., Green, A., et al. 2007, MNRAS, 382, 382 [NASA ADS] [CrossRef] [Google Scholar]
- Nolan, P. L., Abdo, A. A., Ackermann, M., et al. 2012, ApJS, 199, 31 [NASA ADS] [CrossRef] [Google Scholar]
- Osterbrock, D. E. 1989, Astrophysics of Gaseous Nebulae and Active Galactic Nuclei (Mill Valley: Univ. Science Books) [Google Scholar]
- Padovani, P., & Giommi, P. 1995, ApJ, 444, 567 [NASA ADS] [CrossRef] [Google Scholar]
- Rieke, G. H., & Lebofsky, M. J. 1985, ApJ, 288, 618 [NASA ADS] [CrossRef] [Google Scholar]
- Rogel, A. B., Cohn, H. N., & Lugger, P. M. 2008, ApJ, 675, 373 [NASA ADS] [CrossRef] [Google Scholar]
- Sbarufatti, B., Treves, A., Falomo, R., et al. 2006, AJ, 132, 1 [NASA ADS] [CrossRef] [Google Scholar]
- Sbarufatti, B., Ciprini, S., Kotilainen, J., et al. 2009, AJ, 137, 337 [NASA ADS] [CrossRef] [Google Scholar]
- Schlegel, D. J., Barrett, P. E., De Jager, O. C., et al. 1995, ApJ, 439, 322 [NASA ADS] [CrossRef] [Google Scholar]
- Schlegel, D. J., Finkbeiner, D. P., & Davis, M. 1998, ApJ, 500, 525 [NASA ADS] [CrossRef] [Google Scholar]
- Shaw, M. S., Romani, R. W., Cotter, G., et al. 2012, ApJ, 748, 49 [CrossRef] [Google Scholar]
- Shaw, M. S., Romani, R. W., Cotter, G., et al. 2013, ApJ, 764, 135 [NASA ADS] [CrossRef] [Google Scholar]
- Sidro, N., Cortina, J., Mauche, C. W., et al. 2008, in Proc. of 30th International Cosmic Ray Conference, 2, eds. R. Caballero, J. C. D’Olivo, G. Medina-Tanco et al., 715 [Google Scholar]
- Skrutskie, M. F., Cutri, R. M., Stiening, R., et al. 2006, AJ, 131, 1163 [NASA ADS] [CrossRef] [Google Scholar]
- Stephen, J. B., Bassani, L., Landi, R., et al. 2010, MNRAS, 408, 422 [NASA ADS] [CrossRef] [Google Scholar]
- Tsarevsky, G., de Freitas Pacheco, J. A., Kardashev, N., et al. 2005, A&A, 438, 949 [NASA ADS] [CrossRef] [EDP Sciences] [Google Scholar]
- Voges, W., Aschenbach, B., Boller, T., et al. 1999, A&A, 349, 389 [NASA ADS] [Google Scholar]
- Warner, B. 1995, Cataclysmic variable stars (Cambridge: Cambridge University Press) [Google Scholar]
- Watson, M. G., Schröder, A. C., Fyfe, D., et al. 2009, A&A, 493, 339 [NASA ADS] [CrossRef] [EDP Sciences] [Google Scholar]
- Wright, E. L., Eisenhardt, P. R. M., Mainzer, A. K., et al. 2010, AJ, 140, 1868 [NASA ADS] [CrossRef] [Google Scholar]
- Zechlin, H.-S., Fernandes, M. V., Elsässer, D., & Horns, D., 2012, A&A, 538, A93 [NASA ADS] [CrossRef] [EDP Sciences] [Google Scholar]
Appendix A: CVs detected in the sample
Spectroscopy of the putative optical counterparts of two objects (1FGL J0838.6−2828 and 1FGL J1544.5−1127) associated by Stephen et al. (2010) with ROSAT sources 1RXS J083842.1−282723 and 1RXS J154439.4−112820, respectively, yields a surprising result. As one can see in Fig. A.1, both objects show several Balmer lines (up to Hϵ at least) and helium lines in emission. In all cases these spectral features are at redshift z = 0, which of course means that these objects lie within the Galaxy. Their spectral appearance is indeed typical of Galactic CVs (e.g., Warner 1995).
The main spectroscopic results and the main astrophysical parameters which can be inferred from the available observational data are reported in Table A.1. The determination of these parameters has been performed as follows.
The estimate of the reddening along the line of sight was attempted by considering an intrinsic Hα/Hβ line ratio of 2.86 (Osterbrock 1989) and by computing the corresponding color excess from the comparison between the intrinsic line ratio and the measured ratio by applying the Galactic extinction law of Cardelli et al. (1989). However, since both spectra show an inverted Balmer ratio (especially in the case of 1RXS J083842.1−282723), we considered AV ~ 0 in both cases.
To derive the distance of the two CVs we assumed an absolute magnitude MV ~ 9 and an intrinsic color index (V − R)0 ~ 0 mag (Warner 1995). Although this method gives an order-of-magnitude value for the distance of Galactic CVs, our past experience (Masetti et al. 2013 and references therein) tells us that these estimates are in general correct to within 50% of the refined value subsequently determined with more precise approaches.
In Table A.1 the 0.1–2.4 keV X-ray luminosities of the two objects were obtained using the ROSAT fluxes as reported in Stephen et al. (2010) and the thereby inferred distances to the sources.
It can be noted from Table A.1 that both sources present an He ii λ4686/Hβ EW ratio much smaller than 0.5; moreover, the EW of the He ii λ4686 line is smaller than 10 Å in both cases. This is an indication that the two CVs are hosting a non-magnetized white dwarf (see Warner 1995). Because of the nature of these objects, we consider their physical association with the two above mentioned Fermi sources unlikely (see main text for details).
All Tables
Synoptic table containing the main results concerning the two CVs identified in the present sample of ROSAT sources.
Log of the spectroscopic observations presented in this paper (see text for details).
Main optical spectroscopic information concerning BL Lac objects in our sample with detected redshifted spectral lines.
All Figures
|
Fig. 1 Spectra of the optical counterparts of four BL Lacs in our sample. For each panel, the upper box reports the observed spectrum not corrected for the intervening Galactic absorption, while the lower one shows the same spectrum normalized to its continuum. The main spectral features are labeled in the lower panels, with the intervening Galactic features indicated in the lower part of the box and (if present) the features allowing the redshift measurement marked in the above part of it. The symbol ⊕ indicates atmospheric telluric absorption bands. The TNG spectra have been smoothed using a Gaussian filter with σ = 3 Å. |
| In the text | |
|
Fig. 7 Positions of the BL Lacs listed in Table 2 on the αox–αro plane. The thick solid line indicates the region described in Sect. 3.3.2 of Abdo et al. (2010c). The dashed lines correspond to the loci in which the synchrotron peak frequency is 1014, 1015, and 1016 Hz. |
| In the text | |
|
Fig. 8 The [4.6]–[12]/[3.4]–[4.6] MIR color–color plot reporting the positions of γ-ray emitting blazars (in cyan) associated with WISE sources forming the blazar strip (see Massaro et al. 2013a, for more details), together with the BL Lac objects (filled squares) identified in this paper and belonging to the Fermi-ROSAT sample of Stephen et al. (2010). In the diagram, the positions of non-blazar sources in the list of Stephen et al. (2010) are labeled and indicated with open circles. The dashed box indicates the locus of the WISE blazar strip considered by Massaro et al. (2013b) as containing likely TeV-emitting BL Lacs. |
| In the text | |
|
Fig. A.1 Spectra (not corrected for the intervening Galactic absorption) of the optical counterparts of the two CVs identified within the sample of ROSAT sources considered in this paper. For each spectrum, the main spectral features are labeled. The symbol ⊕ indicates atmospheric telluric absorption bands. |
| In the text | |
|
Fig. 2 The same as Fig. 1, but for four more spectra of BL Lacs in our sample. |
| In the text | |
|
Fig. 3 The same as Fig. 1, but for four more spectra of BL Lacs in our sample. |
| In the text | |
|
Fig. 4 The same as Fig. 1, but for four more spectra of BL Lacs in our sample. |
| In the text | |
|
Fig. 5 The same as Fig. 1, but for four more spectra of BL Lacs in our sample. |
| In the text | |
|
Fig. 6 The same as Fig. 1, but for three more spectra of BL Lacs in our sample. |
| In the text | |
Current usage metrics show cumulative count of Article Views (full-text article views including HTML views, PDF and ePub downloads, according to the available data) and Abstracts Views on Vision4Press platform.
Data correspond to usage on the plateform after 2015. The current usage metrics is available 48-96 hours after online publication and is updated daily on week days.
Initial download of the metrics may take a while.