Fig. 1
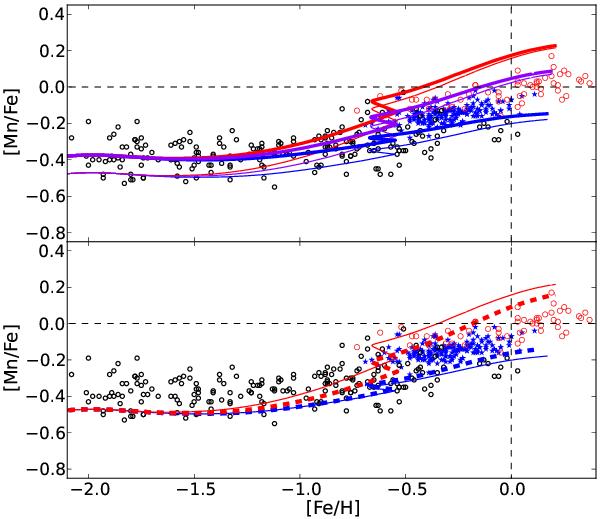
[Mn/Fe] vs. [Fe/H] in the solar vicinity. Open black squares are data from Sobeck et al. (2006), blue stars are from Reddy et al. (2003), and red open dots are thin-disc data from Feltzing et al. (2007). Top panel: thin lines are for massive star yields from Woosley & Weaver (1995), thick lines enhanced their Mn yields by 25 per cent. Red lines are for case MCh, blue lines for case sub-MCh, and case mix are the purple lines. Bottom panel: dashed thick blue line is for case sub-MCh+2002cx, dashed thick red line is for case MCh +. Thin blue and red lines are as in the top panel.
Current usage metrics show cumulative count of Article Views (full-text article views including HTML views, PDF and ePub downloads, according to the available data) and Abstracts Views on Vision4Press platform.
Data correspond to usage on the plateform after 2015. The current usage metrics is available 48-96 hours after online publication and is updated daily on week days.
Initial download of the metrics may take a while.