Fig. 4
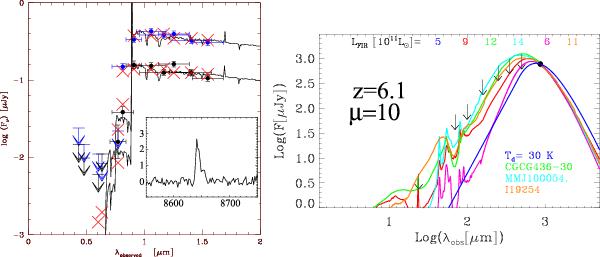
Left: SED fits to the HST/ACS-WFC3 photometry of the images B and D (A is contaminated by a nearby source, C is in a noisy strip of the detector). The best fits give z = 6.3 ± 0.3. The inset shows the VLT/FORS spectrum of the B image with the Ly-α line clearly detected at z = 6.107 (Richard et al., in prep.). The x-axis of the inset corresponds to the observed wavelength in Å. Right: SED fits to the 870 μm northern peak taking into account the upper limits listed in the Table 1 and assuming z = 6.1 and μ = 10 (all the fluxes are corrected for magnification). The modified black-body SED with Td = 30 K is shown in blue, it gives a FIR luminosity LFIR = 5 × 10¹¹ L⊙. The other templates come from the the Chary & Elbaz (2001) library (red), the Vega et al. (2008) library (green), the Michałowski et al. (2010a,b) library (cyan), and the Polletta et al. (2007) library (orange). The template in magenta corresponds to the SMM J2135-0102 model (Swinbank et al. 2010; Ivison et al. 2010).
Current usage metrics show cumulative count of Article Views (full-text article views including HTML views, PDF and ePub downloads, according to the available data) and Abstracts Views on Vision4Press platform.
Data correspond to usage on the plateform after 2015. The current usage metrics is available 48-96 hours after online publication and is updated daily on week days.
Initial download of the metrics may take a while.