Fig. 7
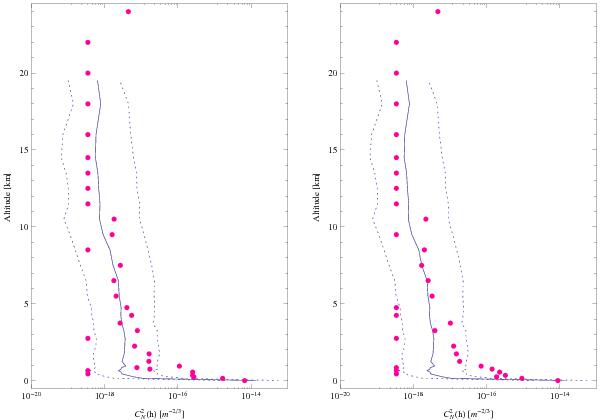
Example of  profile
(dots) from PML at Dome C in Antarctica on January 25, 2011 at 16h45UT (left
panel) and 17h17 (right panel). For comparison, the median
profile (solid line) of radio-sounding balloons obtained during the 2005 winter
campaign is plotted in solid line. Dotted lines indicate the 10% and 90% percentiles
of the balloon data.
profile
(dots) from PML at Dome C in Antarctica on January 25, 2011 at 16h45UT (left
panel) and 17h17 (right panel). For comparison, the median
profile (solid line) of radio-sounding balloons obtained during the 2005 winter
campaign is plotted in solid line. Dotted lines indicate the 10% and 90% percentiles
of the balloon data.
Current usage metrics show cumulative count of Article Views (full-text article views including HTML views, PDF and ePub downloads, according to the available data) and Abstracts Views on Vision4Press platform.
Data correspond to usage on the plateform after 2015. The current usage metrics is available 48-96 hours after online publication and is updated daily on week days.
Initial download of the metrics may take a while.