Fig. 6
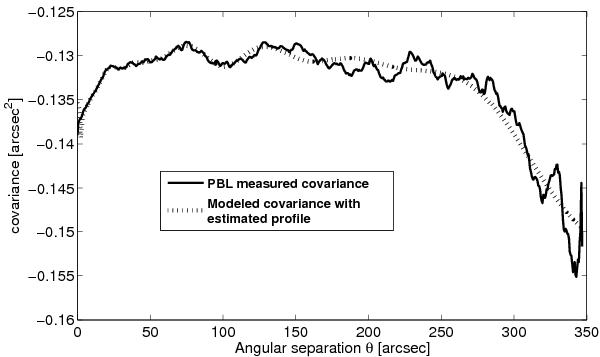
Example of lateral covariance Y(θ) obtained with
PML at Dome C in Antarctica on January 25, 2011 at 16h45 UT (solid line). The PML
extracted  profile is obtained by
modeling angular covariance (dotted line) leading to the best fit of the measured
covariance (solid line).
profile is obtained by
modeling angular covariance (dotted line) leading to the best fit of the measured
covariance (solid line).
Current usage metrics show cumulative count of Article Views (full-text article views including HTML views, PDF and ePub downloads, according to the available data) and Abstracts Views on Vision4Press platform.
Data correspond to usage on the plateform after 2015. The current usage metrics is available 48-96 hours after online publication and is updated daily on week days.
Initial download of the metrics may take a while.