Fig. 8
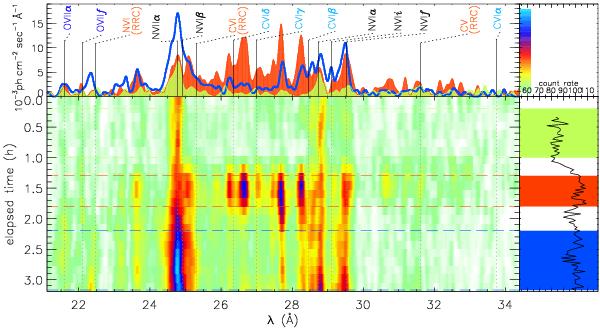
Transition into the SSS phase observed with XMM-Newton in RS Oph starting day 26.12 after the 2006 outburst. The EPIC/pn light curve is shown to the right with three coloured shades marking time intervals from which the spectra in the top have been extracted. Line labels that belong to strong transitions in nitrogen (black), carbon (light blue), and oxygen (dark blue) are included, as well as Radiative Recombination Continuum (RRC) features in red. The central image is a brightness spectral/time map that uses a colour code from light green to light blue representing increasing flux values as shown with the colour bar along the spectral flux axis in the top right. See also Fig. 6 in Ness (2012).
Current usage metrics show cumulative count of Article Views (full-text article views including HTML views, PDF and ePub downloads, according to the available data) and Abstracts Views on Vision4Press platform.
Data correspond to usage on the plateform after 2015. The current usage metrics is available 48-96 hours after online publication and is updated daily on week days.
Initial download of the metrics may take a while.