Fig. 6
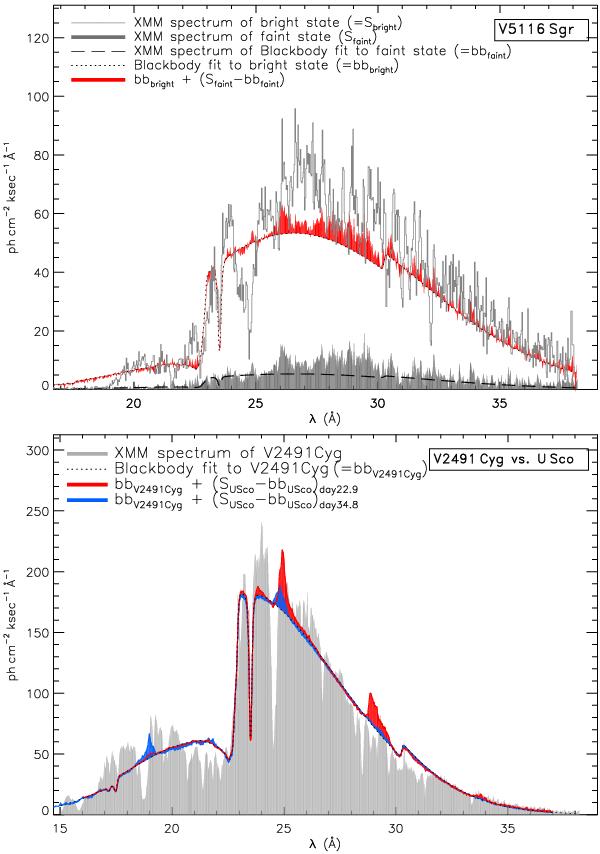
Comparison of SSe and SSa spectra for the high/low state spectra of V5116 Sgr (top) and the two best examples of SSa, V2491 Cyg, and SSe, U Sco, (bottom). The emission line component in SSe spectra, obtained by removing the weak continuum component, is added the continuum component of an SSa spectrum. The continua are approximated by blackbody models. The SSe emission line components are comparable in strength to complex atmospheric absorption/emission features in SSa.
Current usage metrics show cumulative count of Article Views (full-text article views including HTML views, PDF and ePub downloads, according to the available data) and Abstracts Views on Vision4Press platform.
Data correspond to usage on the plateform after 2015. The current usage metrics is available 48-96 hours after online publication and is updated daily on week days.
Initial download of the metrics may take a while.