Fig. 4
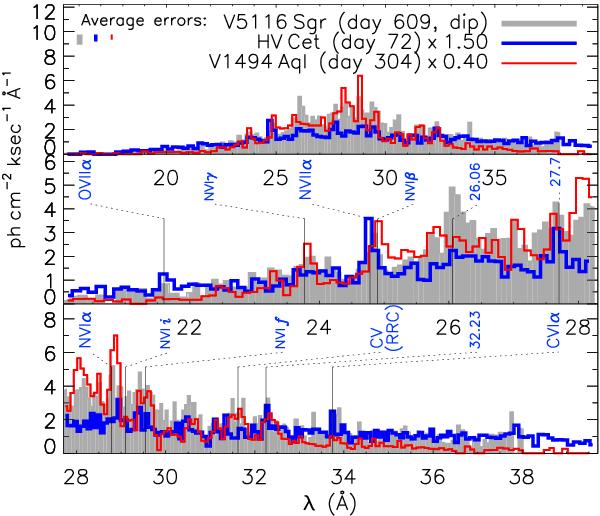
Examples of intermediate cases: comparison of high-resolution X-ray spectra of the CNe V5116 Sgr, HV Cet, and V1494 Aql. The wavelengths of important transitions are marked and labelled. Lines found in other nova spectra in absorption but without having been identified are included with their wavelength values. (The concept is the same as described in Fig. 2.)
Current usage metrics show cumulative count of Article Views (full-text article views including HTML views, PDF and ePub downloads, according to the available data) and Abstracts Views on Vision4Press platform.
Data correspond to usage on the plateform after 2015. The current usage metrics is available 48-96 hours after online publication and is updated daily on week days.
Initial download of the metrics may take a while.