Fig. 2
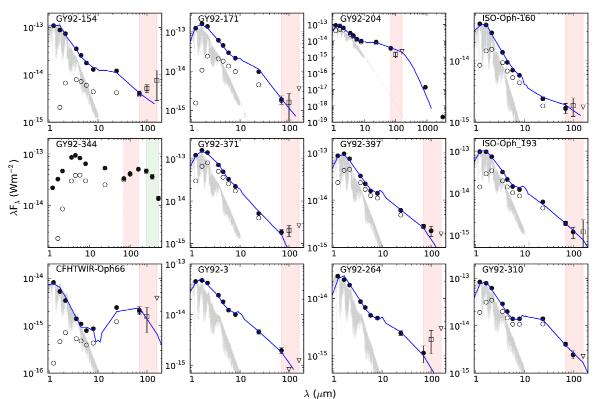
SEDs of the young brown dwarfs detected with Herschel. All fluxes have been dereddened using the visual extinction values from Table 1 and are shown as filled circles for >3σ detections; open squares depict marginal detections (1<σ<3), and open triangles show 1σ upper limits. The original fluxes are marked with open circles. The Herschel/PACS wavelength range is shown by the red shaded region, and for GY92 344 the Herschel/SPIRE wavelength range is marked by the green shaded region. NextGen model photospheres are shown in light grey. The model with the best-fit parameters is overplotted in blue.
Current usage metrics show cumulative count of Article Views (full-text article views including HTML views, PDF and ePub downloads, according to the available data) and Abstracts Views on Vision4Press platform.
Data correspond to usage on the plateform after 2015. The current usage metrics is available 48-96 hours after online publication and is updated daily on week days.
Initial download of the metrics may take a while.