Fig. 6
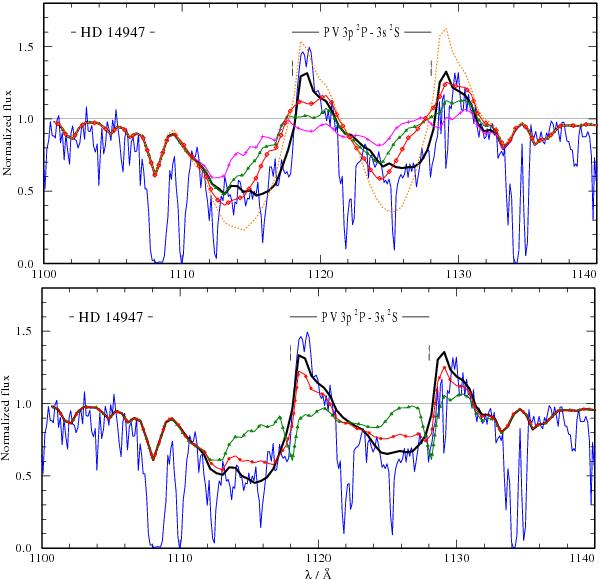
Comparison between calculated P v and observed (thin solid-blue lines) line profiles of HD 14947. Upper panel: effect of the number of clumps. The purple line with crosses is calculated with d = 0, rcl = 1, m = 0.1, and L0 = 0.5. The green line with triangles and the red line with squares differ only by L0 = 0.2 and L0 = 0.1, respectively. The thick solid black line is calculated with rcl = 1, m = 0.1, L0 = 0.5, and d = 0.2. The dotted orange line is from the PoWR model and corresponds to a smooth wind. Lower panel: effect of the onset of clumping and the interclump medium density. The green line with triangles is calculated with d = 0, rcl = 1.1, m = 0.1, and L0 = 0.5. The red line with asterisks differs only by d = 0.1, while the thick solid black line is for d = 0.2 so it differs against the thick solid black line in the upper panel only by the different rcl = 1.1. The remaining clump parameters are fixed as given in Table 4.
Current usage metrics show cumulative count of Article Views (full-text article views including HTML views, PDF and ePub downloads, according to the available data) and Abstracts Views on Vision4Press platform.
Data correspond to usage on the plateform after 2015. The current usage metrics is available 48-96 hours after online publication and is updated daily on week days.
Initial download of the metrics may take a while.