Fig. 5
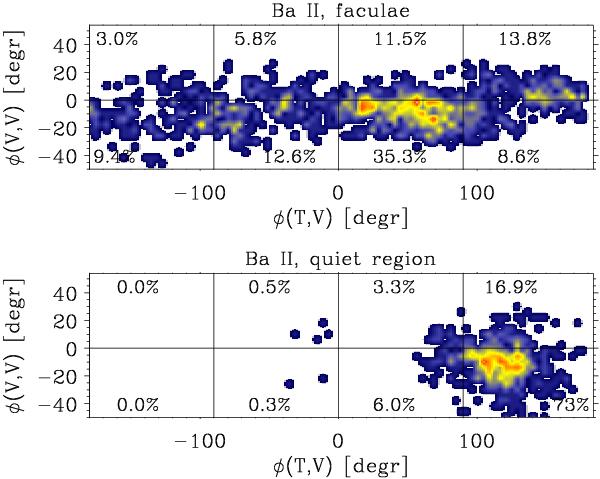
Phase shift between the velocities at the bottom and top of the photosphere φ(V,V) as a function of the phase shift between the velocity and temperature at the upper photosphere φ(T,V) for the plage area (upper row) and for the quiet area (bottom row). The yellow and red colours denote a greater density of points in the distribution. Negative velocity–velocity shifts, φ(V,V), mean upward waves.
Current usage metrics show cumulative count of Article Views (full-text article views including HTML views, PDF and ePub downloads, according to the available data) and Abstracts Views on Vision4Press platform.
Data correspond to usage on the plateform after 2015. The current usage metrics is available 48-96 hours after online publication and is updated daily on week days.
Initial download of the metrics may take a while.