Fig. 4
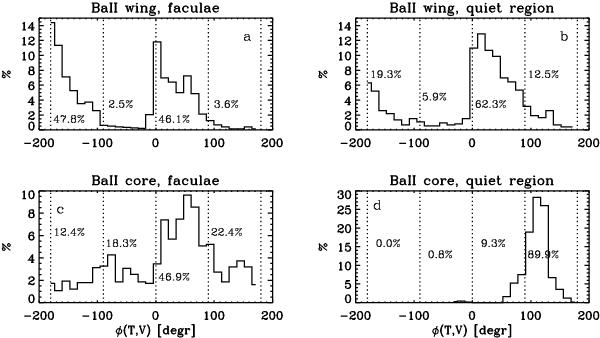
Histograms of the phase shifts between the temperature (in anti-phase with intensity) and velocity oscillations φ(T,V) for the bottom photosphere (upper row), and the upper photosphere (bottom row). The panels on the left show the results for the facular region analysed in this paper. The panels on the right show a similar result, but for the quiet region data from Kostik et al. (2009).
Current usage metrics show cumulative count of Article Views (full-text article views including HTML views, PDF and ePub downloads, according to the available data) and Abstracts Views on Vision4Press platform.
Data correspond to usage on the plateform after 2015. The current usage metrics is available 48-96 hours after online publication and is updated daily on week days.
Initial download of the metrics may take a while.