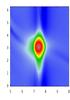
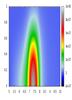
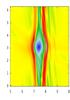
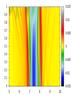
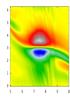
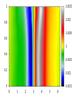
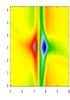
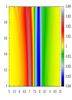
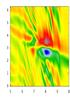
Fig. 8
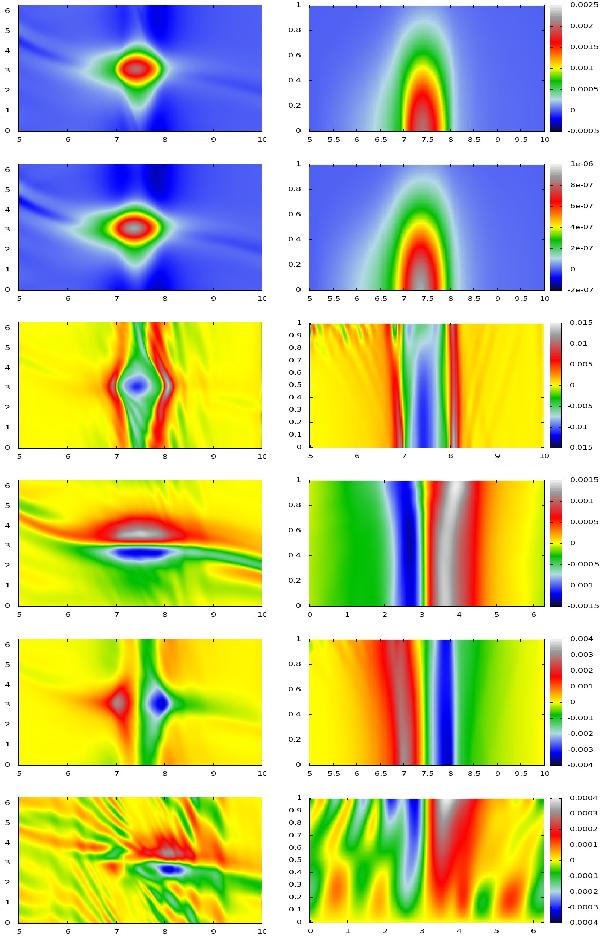
Structure of a 3D Rossby vortex. From top to bottom the various rows show the fields (where the stable equilibrium state has been removed) of density, pressure, axial vorticity, radial velocity, azimuthal velocity, and vertical velocity. The left column shows these values in the r − θ plane at z = 0 except for the vertical velocity (last row), which is at z = 0.5. The right column shows the vertical profiles of the same values in the r − z plane at θ = 2.67; radial velocity (fourth row) and vertical velocity (last row) are plotted in the θ − z plane at r = 8.
Current usage metrics show cumulative count of Article Views (full-text article views including HTML views, PDF and ePub downloads, according to the available data) and Abstracts Views on Vision4Press platform.
Data correspond to usage on the plateform after 2015. The current usage metrics is available 48-96 hours after online publication and is updated daily on week days.
Initial download of the metrics may take a while.