Fig. 2
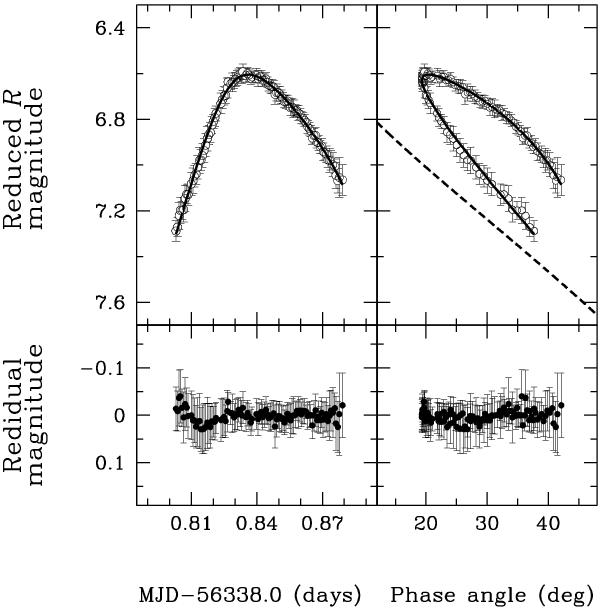
Brightness variations of 2012 DA14 around the closest approach at 19:33 UT on February 15, 2013 (MJD 56 338.8146). The upper left and upper right panels show the lightcurve with time and solar phase angle, respectively. The open circles and solid line represent the photometric data and the best-fit model generated by a combination of the H-G phase function. The dashed line in the upper right panel represents the model phase function with G = 0.44, which was derived from our best-fit model. The lower left and lower right panels show the residual to the best-fit model of the lightcurves with time and solar phase angle, respectively. In the all panels, the error bars indicate the 1σ photometric uncertainties.
Current usage metrics show cumulative count of Article Views (full-text article views including HTML views, PDF and ePub downloads, according to the available data) and Abstracts Views on Vision4Press platform.
Data correspond to usage on the plateform after 2015. The current usage metrics is available 48-96 hours after online publication and is updated daily on week days.
Initial download of the metrics may take a while.