Open Access
Fig. 22
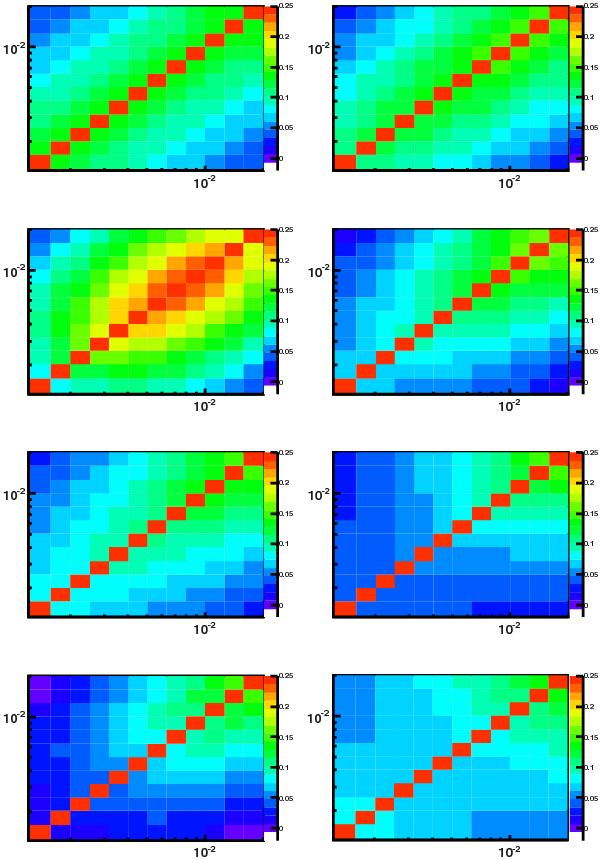
Correlation matrices between the different k-modes for the first 8 redshift bins (z = [2.1−3.7]), smoothed by 2D second-degree polynomials, for the FT method. The color range is identical in all 8 plots, with red for all values above 0.25.
Current usage metrics show cumulative count of Article Views (full-text article views including HTML views, PDF and ePub downloads, according to the available data) and Abstracts Views on Vision4Press platform.
Data correspond to usage on the plateform after 2015. The current usage metrics is available 48-96 hours after online publication and is updated daily on week days.
Initial download of the metrics may take a while.