Fig. 16
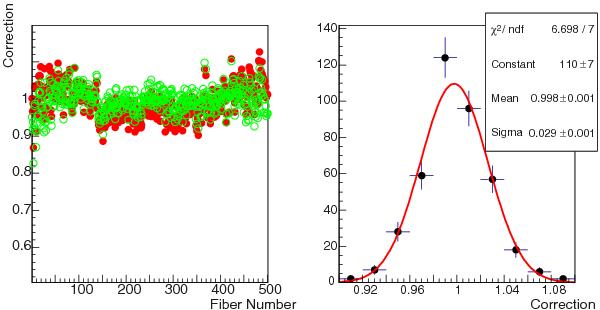
Left: discrepancy between pipeline and arc lamp resolution as a function of the fiber number before correction (red dots) and after correction of Sect. 2.4 (green circles). This plot is obtained for the Cd line at ~4800 Å. Right: distribution of the residuals of the resolution correction; the rms of the green distribution, ~3.0%, provides an estimate of the uncertainty on the resolution correction.
Current usage metrics show cumulative count of Article Views (full-text article views including HTML views, PDF and ePub downloads, according to the available data) and Abstracts Views on Vision4Press platform.
Data correspond to usage on the plateform after 2015. The current usage metrics is available 48-96 hours after online publication and is updated daily on week days.
Initial download of the metrics may take a while.