Free Access
Fig. 6
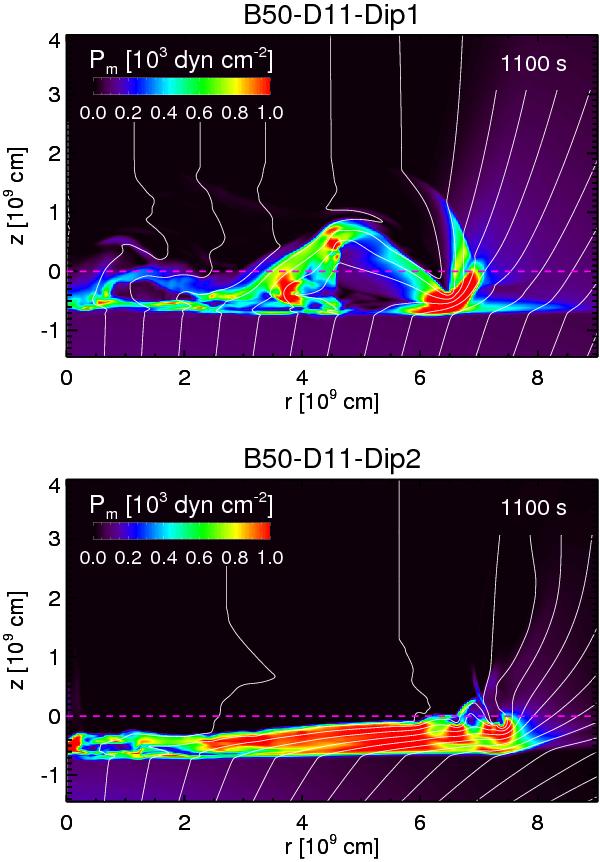
Maps of magnetic pressure Pm in the (r,z) plane in simulations B50-D11-Dip1 and B50-D11-Dip2 at the labeled times. The initial position of the transition region between the chromosphere and the corona is at z = 0 (dashed magenta lines). The white lines mark magnetic field lines.
Current usage metrics show cumulative count of Article Views (full-text article views including HTML views, PDF and ePub downloads, according to the available data) and Abstracts Views on Vision4Press platform.
Data correspond to usage on the plateform after 2015. The current usage metrics is available 48-96 hours after online publication and is updated daily on week days.
Initial download of the metrics may take a while.