Fig. 3
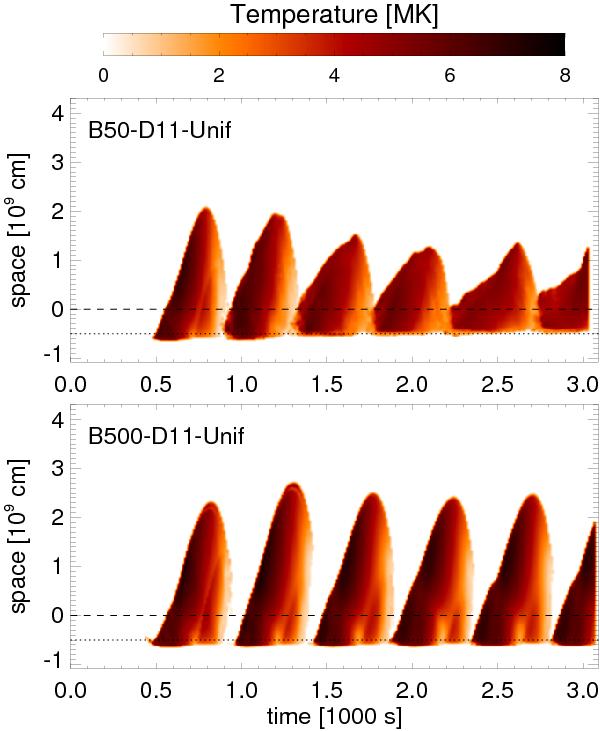
Time-space plots of the emission-measure-weighted temperature evolution for runs B50-D11-Unif and B500-D11-Unif. The spatial extent of the postshock plasma in the z-direction lies in the vertical direction at any time. The dashed line marks the initial position of the transition region between the chromosphere and the corona; the dotted line marks the minimum sinking of the slab into the chromosphere in runs B50-D11-Unif and B500-D11-Unif.
Current usage metrics show cumulative count of Article Views (full-text article views including HTML views, PDF and ePub downloads, according to the available data) and Abstracts Views on Vision4Press platform.
Data correspond to usage on the plateform after 2015. The current usage metrics is available 48-96 hours after online publication and is updated daily on week days.
Initial download of the metrics may take a while.