Fig. 2
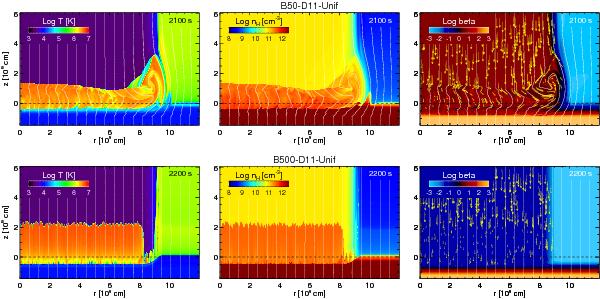
Temperature (left panels), plasma density (center panels), and plasma β (right panels) distributions in the (r,z) plane in log scale in the simulations B50-D11-Unif (upper panels) and B500-D11-Unif (lower panels) at the labeled times. The initial position of the transition region between the chromosphere and the corona is at z = 0 (dashed line). The initial magnetic field is uniform and oriented along the z-axis; the white lines mark magnetic field lines. The yellow arrows in the right panels map the velocity field.
Current usage metrics show cumulative count of Article Views (full-text article views including HTML views, PDF and ePub downloads, according to the available data) and Abstracts Views on Vision4Press platform.
Data correspond to usage on the plateform after 2015. The current usage metrics is available 48-96 hours after online publication and is updated daily on week days.
Initial download of the metrics may take a while.