Fig. 3
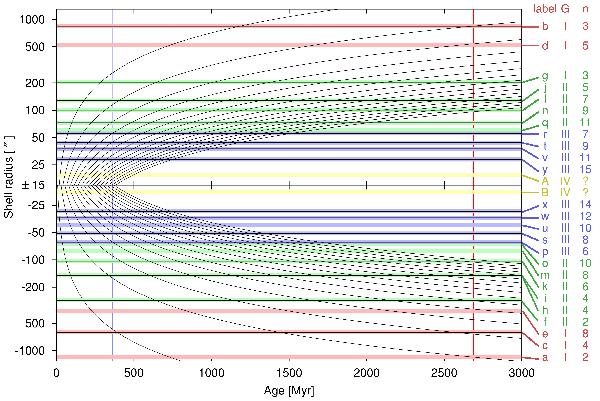
Calculated time evolution of shell radii in our potential (black curves). The observed radii of shells plus 5% uncertainty boundaries (horizontal lines). The shells from the same generations are marked by identical colors. The age of a generation is marked by the vertical line of the same color. The calculated shell radii should ideally reach their observed values at the times marked by the vertical lines. The shells can be identified in Table 1 by their labels. The other two columns on the right denote the identified generation to which the shell belongs and its number. The signs of the shells from the first column of Table 1 had to be multiplied by the value in column to take into account the directions of the individual collisions. The sign of shell i was switched since it is interpreted as shell h encircling the galaxy. The two innermost shells probably come from the fourth generation and were not formed in the manner that our model assumes.
Current usage metrics show cumulative count of Article Views (full-text article views including HTML views, PDF and ePub downloads, according to the available data) and Abstracts Views on Vision4Press platform.
Data correspond to usage on the plateform after 2015. The current usage metrics is available 48-96 hours after online publication and is updated daily on week days.
Initial download of the metrics may take a while.