Free Access
Fig. 2
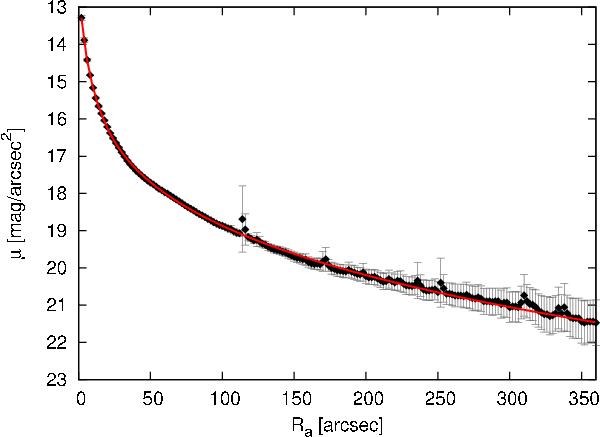
Surface brightness profile of NGC 3923 (Spitzer Space telescope IRAC 3.6 μm bandpass). The semi-major axis of the isophotal ellipses, Ra, is given on the horizontal axis. Black points with gray error-bars show the observed profile; the red line shows fit by the sum of two Sérsic profiles (see Table 2).
Current usage metrics show cumulative count of Article Views (full-text article views including HTML views, PDF and ePub downloads, according to the available data) and Abstracts Views on Vision4Press platform.
Data correspond to usage on the plateform after 2015. The current usage metrics is available 48-96 hours after online publication and is updated daily on week days.
Initial download of the metrics may take a while.