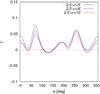
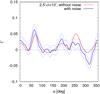
Fig. 6

Optimal matched linear filter applied to realistic data. Left panel: the filter response on a mock catalog based on the N-body numerical simulation without noise and as a function of scanning angle. Each line represents the result for three different radial cutoffs. Right panel: this case considers the noise given by a finite source number density of ns = 15 arcmin-2 and an intrinsic ellipticity rms of σg = 0.4. The red line represents the expected theoretical signal (the same as in the left panel), the blue line the filter outcome for noisy data, and the dashed blue lines its ~ 1σ upper and lower uncertainty. The most significant filamentary structure (at α ~ 70 deg) has been recovered at the ~ 4σ level, all others are detected with a lower significance.
Current usage metrics show cumulative count of Article Views (full-text article views including HTML views, PDF and ePub downloads, according to the available data) and Abstracts Views on Vision4Press platform.
Data correspond to usage on the plateform after 2015. The current usage metrics is available 48-96 hours after online publication and is updated daily on week days.
Initial download of the metrics may take a while.