Fig. 6
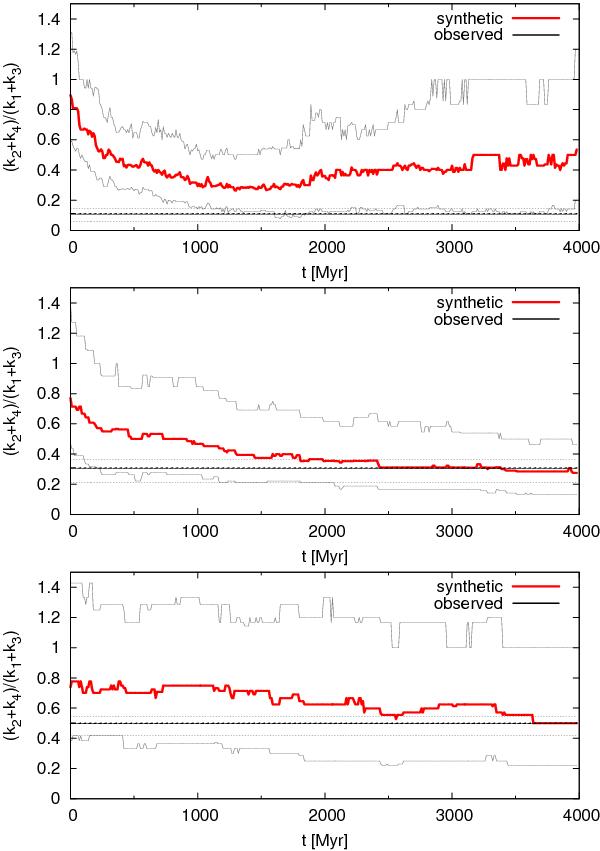
Time evolution of the metric (k2 + k4)/(k1 + k3), where ki correspond to the numbers of synthetic objects in quadrants i (i = 1,2,3,4) that are defined by the center of the family and value β = 0°, for synthetic Flora, Koronis, and Eos families (red lines). The spread corresponds to 100 different selections of objects (we simulate 10 times more objects to reach a better statistics). the upper curve denotes the 90% quantile and the bottom 10%. Thick horizontal line is the observed ratio (k2 + k4)/(k1 + k3) with the uncertainty interval.
Current usage metrics show cumulative count of Article Views (full-text article views including HTML views, PDF and ePub downloads, according to the available data) and Abstracts Views on Vision4Press platform.
Data correspond to usage on the plateform after 2015. The current usage metrics is available 48-96 hours after online publication and is updated daily on week days.
Initial download of the metrics may take a while.