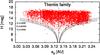
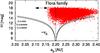
Fig. 1

Dependence of the absolute magnitude H on the proper semi-major axis ap for the Themis family (left) and for the Flora family (right) with the likely positions of the family centers (vertical lines). We also plot three (ap, H) borders of the family for different parameters C (different values correspond to a different initial extent of the family or different age and magnitude of the Yarkovsky semi-major axis drift) by gray lines, the optimal border corresponds to the middle line. The vertical dotted line represents the approximate position of the secular ν6 resonance for the inclination typical for Flora family members and the horizontal arrow its approximate range.
Current usage metrics show cumulative count of Article Views (full-text article views including HTML views, PDF and ePub downloads, according to the available data) and Abstracts Views on Vision4Press platform.
Data correspond to usage on the plateform after 2015. The current usage metrics is available 48-96 hours after online publication and is updated daily on week days.
Initial download of the metrics may take a while.