| Issue |
A&A
Volume 559, November 2013
|
|
|---|---|---|
| Article Number | A87 | |
| Number of page(s) | 8 | |
| Section | Stellar structure and evolution | |
| DOI | https://doi.org/10.1051/0004-6361/201321991 | |
| Published online | 20 November 2013 | |
Hα observations of the γ-ray-emitting Be/X-ray binary LSI+61°303: orbital modulation, disk truncation, and long-term variability ⋆,⋆⋆
1
Institute of Astronomy and National Astronomical Observatory, Bulgarian
Academy of Sciences,
72 Tsarighradsko Shousse Blvd.,
1784
Sofia,
Bulgaria
e-mail: rkz@astro.bas.bg; kstoyanov@astro.bas.bg; tomov@astro.bas.bg
2
Departamento de Física (EPSJ), Universidad de Jaén,
Campus Las Lagunillas, A3-420,
23071
Jaén,
Spain
e-mail:
jmarti@ujaen.es
3
Department of Astronomy, St. Kliment Ohridski University of
Sofia, 5 James Bourchier
Blvd., 1164
Sofia,
Bulgaria
4
Department of Physics and Astronomy, Pevensey II Building,
University of Sussex, Falmer, Brighton
BN1 9QH,
UK
5
Departamento de Ingeniería Mecánica y Minera (EPSJ), Universidad
de Jaén, Campus Las Lagunillas
A3-008, 23071
Jaén,
Spain
Received: 30 May 2013
Accepted: 10 September 2013
We report 138 spectral observations of the Hα emission line of the radio- and γ-ray-emitting Be/X-ray binary LSI+61°303 obtained during the period of September 1998 – January 2013. From measuring various Hα parameters, we found that the orbital modulation of the Hα is best visible in the equivalent width ratio EW(B)/EW(R), the equivalent width of the blue hump, and in the radial velocity of the central dip. The periodogram analysis confirmed that the Hα emission is modulated with the orbital and superorbital periods. For the past 20 years the radius of the circumstellar disk is similar to the Roche lobe size at the periastron. It is probably truncated by a 6:1 resonance. The orbital maximum of the equivalent width of Hα emission peaks after the periastron and coincides on average with the X-ray and γ-ray maxima. All the spectra are available upon request from the authors and through the CDS.
Key words: stars: individual: LSI+61303 / stars: winds, outflows / stars: emission-line, Be / X-rays: binaries
Table 1 and all the spectra are only available at the CDS via anonymous ftp to cdsarc.u-strasbg.fr (130.79.128.5) or via http://cdsarc.u-strasbg.fr/viz-bin/qcat?J/A+A/559/A87
© ESO, 2013
1. Introduction
The Be/X-ray binary LSI+61°303 was first detected as strong γ-ray source with COS B (Hermsen et al. 1977) and as an X-ray source with the Einstein observatory (Bignami et al. 1981). The Be/X-ray binaries (BeXRB) are systems that consist of a compact object that orbits an optical companion. The optical companion is a Be star. Be stars are non-supergiant fast-rotating B-type and luminosity class III–V stars that at some point of their lives have shown spectral lines in emission (Porter & Rivinius 2003; Balona 2000; Slettebak 1988). The best-studied lines are those of hydrogen (Balmer and Paschen series), but the Be stars can also show He and Fe in emission (see Hanuschik 1996, and references therein). They also show some infrared excess. The origin of the emission lines and infrared excess in BeXBR is attributed to an equatorial disk that is fed from material expelled from the rapidly rotating Be star. During periastron, the compact object passes close to this disk, sometimes may even go through it and cause a major disruption. A strong flow of matter is then captured by the compact object. In most cases the compact object is a neutron star (NS) detected as an X-ray pulsar (Bildsten et al. 1997, and references therein). The conversion of the kinetic energy of the infalling matter into radiation powers the X-rays.
The high-mass X-ray binary LS I +61° 303 (V615 Cas) is known as a variable radio source (Gregory et al. 1979) characterized by nonthermal periodic radio outbursts (Gregory & Taylor 1978). Its energetic outbursts are also visible in X-rays (Greiner & Rau 2001; Harrison et al. 2000), and GeV wavelengths (Abdo et al. 2009; Albert et al. 2008; Acciari et al. 2008). The system has a relatively low X-ray luminosity for a high-mass X-ray binary, but is one of the 20 brightest γ-ray sources known and detectable up to TeV energy range. It is one of only few such systems identified as a source of TeV gamma rays. Indeed, it is currently considered to be a member of the new class of gamma-ray-emitting binaries, that is binary systems whose luminosity output has a dominating component at gamma-ray energies (see e.g. Paredes et al. 2013).
LSI+61°303 consists of a massive B0Ve star and a compact object. The nature of the compact object remains a mystery even after four decades of observations over a wide range of wavelengths. Most probably it is a magnetic neutron star, but it might be a magnetized black hole (Punsly 1999) acting as a precessing microblazar (Massi et al. 2012). The compact object moving in an eccentric orbit interacts with the Be circumstellar disk, producing strong orbital modulation in the emission across the electromagnetic spectrum: radio flux (Gregory & Taylor 1978; Taylor et al. 1992), X-ray (Paredes et al. 1997; Leahy 2001), optical V magnitude (Mendelson & Mazeh 1994; Zaitseva & Borisov 2003), TeV (Albert et al. 2006, 2008), and optical Hα emission line (Zamanov et al. 1999; Grundstrom et al. 2007a). The radio morphology of the system also shows unique characteristics. The resolved extended structure changes position angle with a surprisingly large variation (Massi et al. 2004).
The motion on the sky determined with high precision astrometry implies that LSI+61°303 was ejected from the stellar cluster IC 1805 by the kick imparted to the compact object in an asymmetric supernova explosion ~1.7 × 10⁶ yr ago (Mirabel et al. 2004).
Additionally to the 26.5 d orbital modulation, a 4.4 yr periodic modulation of the phase and amplitude of the radio outbursts has been discovered (Paredes 1987; Gregory et al. 1989). This superorbital modulation has been detected in Hα (Zamanov et al. 1999). The first clues that the 4 yr modulation is also visible in X-rays have been given by Apparao (2001), and are now confirmed by Li et al. (2012) using the longest monitoring performed to date by the Rossi X-ray Timing Explorer (RXTE).
In this paper we present Hα observations of LS I +61° 303 obtained during the past 15 years, and discuss disk truncation, long-term variability, orbital modulation, and connection with high-energy emission.
2. Observations
All data reported here were obtained by the 2.0 m RCC telescope of the National Astronomical Observatory Rozhen located in the Rhodope mountain range, Bulgaria. The star LSI+61°303 was observed between September 1998 and January 2013 with the Coudé spectrograph of this telescope. The spectra cover 200 Å around Hα, with a resolution of 0.2 Å pixel-1.
The spectra were reduced in the standard way including bias removal, flat-field correction, wavelength calibration, and correction for the Earth’s motion. Pre-processings and measurements were performed using various routines provided by IRAF. The spectra obtained within each observational night were processed and measured independently.
Table 1 lists the spectrum ID (the first six digits corresponding to the date – YYYYMMDD), JD of the start of the exposure, exposure time in minutes, signal-to-noise ratio (S/N) calculated for the continuum in the wavelength range 6620–6655 Å. On each spectrum we measured the total equivalent width of the Hα emission line, hereafter EW, the heliocentric radial velocities of the central dip Vr(cd), blue and red humps, Vr(B) and Vr(R) respectively, the ratio between the equivalent widths of the blue and red humps, the intensity of the blue peak IB, the intensity of the red peak IR, and the intensity of the central depression Icd. The intensities were measured after normalization to the local continuum, IC ≡ 1. The B/R ratio was calculated as B/R = IB/IR (this ratio is more often called V/R ratio, but most of the papers on LSI+61°303 use B/R). The equivalent width of the blue hump, EW(B), was measured from the violet end to the central dip. The equivalent width of the red hump, EW(R), was measured from the central dip to the red end of the line, in this way: EW = EW(B) + EW(R). We also give radial velocity of the HeIλ6678.151 absorption line. The radial velocities were measured by employing a Gaussian fit. The errors depend mostly on the S/N, and we estimated them to be about 5% for EW, about 10 km s-1 for the radial velocities, and 0.01 for the intensity.
A few examples of our spectra are plotted in Fig. 1. The long-term variability of EW and ΔV are presented in Fig. 2.
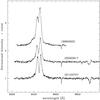 |
Fig. 1 Three examples of Hα profiles. The upper spectrum is taken from the time of maximal EW = 18.2 Å (19 960 825). The middle spectrum has a EW = 13.1 Å (2 000 917). The lower spectrum (20 120 707, EW = 10.8) is taken at a moment when the star fulfilled the shell criterion (see also Sect. 5.3). |
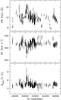 |
Fig. 2 Long-term variability of the equivalent width EW(Hα), the distance between the peaks of the Hα emission line, and the calculated radius of the Hα-emitting circumstellar disk. The arrow in the upper panel corresponds to the time of the γ-ray flux transition (see also Sect. 5.4.1). |
3. Periodogram analysis of the Hα parameters
3.1. Detection of the orbital variability
We conducted a period analysis for the different Hα line parameters listed in Table 1, and also using data from McSwain et al. (2010), Grundstrom et al. (2007a), Liu & Yan (2005), Zamanov et al. (1999), Paredes et al. (1994), Steele et al. (1996). The period-search methods were the phase dispersion minimization (PDM; Stellingwerf 1978) and the CLEAN algorithm (Roberts et al. 1987). As a result, we confirm with a higher precision that the Hα emission in LSI+61 303 displays variations with the orbital period. The orbital modulation is better revealed in the ratio EW(B)/EW(R), EW(B), and Vr(cd).
In Fig. 3 we present the PDM and CLEAN periodograms for EW(B)/EW(R). The most significant period detected in the range 10–60 d corresponds to 26.498 d and 26.499 d for the PDM and CLEAN methods respectively. Using different Hα parameters, we obtain, an averaged value 26.502 ± 0.007 d, which is not an improvement over the radio orbital period. Thus, the Hα emission line appears to match the same orbital period of 26.4960 ± 0.0028 d obtained with Bayesian analysis of radio data (Gregory 2002).
3.2. Long-term variability
In addition to the orbital periodicity, another clock is operating in LSI+61°303, whose physical mechanism is not yet clear. The phase and amplitude of the radio outbursts are known to exhibit a long-term 1600-day modulation (Paredes 1987; Gregory et al. 1989; Gregory 2002).
A visual inspection of Fig. 2 data suggests that a modulation of a few years may also be present. To quantitatively address this superorbital-period question, all the PDM and CLEAN analyses were extended up to 4000 d (i.e. half the full time-span of the data). The resulting periodograms (not shown here) suggested possible frequency components around ~1800 d. However, a precise determination of these long-term periodicities was difficulted due to the uneven sampling of the data and because only four superorbital cycles are covered. To obtain our best estimate, we applied a parametric harmonic modeling of the signal. This can be achieved in a three-stage procedure. After detrending the data, the well-known Lomb-Scargle Fourier method was applied to estimate the frequencies and number of components above the 99% confidence level. Amplitudes and phases were then determined by means of a linear fit. The resulting parameters were used as starting estimates for a nonlinear optimization. After building the component model, it was used to determine the definitive frequencies by means of traditional Fourier analysis because now the model could be evenly sampled. As a final result, we obtained a refined estimate of the initially selected frequency components.
In our case, we maintained the three main frequencies resulting from the Lomb-Scargle algorithm. Residuals are within the 90% critical limit, thus indicating that they follow a Gaussian distribution, and therefore the model seems to be well-established. Our best parametric harmonic modeling results are presented in the peridogram of Fig. 4. Here, the three main frequencies are clearly detected finally above the 99.9% confidence level. They correspond to periods of 26.6, 76.3, and 1775 d. The first value is obviously the orbital period, while the second one is close to, but not exactly coincident with, a harmonic of the former. The third period revealed in Fig. 4 corresponds to a 4.86 yr modulation, that is, very similar to the period originally discovered at radio wavelengths.
This is the first time that the LSI+61 303 superorbital period is blindly detected in the optical spectroscopic properties of the source using periodogram techniques and thus confirms our early findings (Zamanov et al. 1999) that Hα is modulated with a superorbital period.
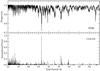 |
Fig. 3 Periodograms for the ratio EWB/EWR of LSI+61°303. They are computed using the PDM and CLEAN methods. The orbital period is detected in both cases as the most significant one. |
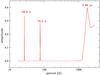 |
Fig. 4 Results of harmonic fit to the EW data, which clearly show the orbital period and a 4.5 yr long-term modulation. |
4. Variability of the Hα parameters
4.1. EW(Hα)
In our observations, the EW(Hα) of LSI+61°303 varies in the interval 7.8–18.9 Å, with average  Å, and standard deviation of the mean σ(EW) = 2.1 Å.
For the BeXRBs a correlation has been established between the orbital period and the maximal EW (Reig et al. 1997). An updated version of this correlation is given by Reig (2011). The maximum EW of LSI+61°303 observed until now (EW = 18.9 Å at JD 2 450 322) is slightly higher than the average behavior of the Be/X-ray binaries.
The linear regression for the γ-ray binaries (see Eq. (2) of Casares et al. 2012a) predicts for LSI+61°303 a value for the maximum EW ≈ 15.5 Å. The observed value is again slightly higher than the predicted from the correlation.
4.2. B0V primary star
For the primary we assumed a B0V star of M1 = 12.5 ± 2.5 M⊙ (Hutchings & Crampton 1981; Casares et al. 2005). We also adopted Porb = 26.496 d and an eccentricity e = 0.537 (Aragona et al. 2009). For the mass of the compact object, we assumed 1.4 M⊙ for a neutron star and 4 M⊙ for a black hole (see also Aragona et al. 2009). Using Kepler’s law 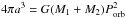 , we calculated the semimajor axis of the system.
For the radius of the primary, using M1 = 12.5 M⊙ and Demircan & Kahraman (1991) equations, we obtained R1 = 4.3 R⊙ for ZAMS, R1 = 13.1 R⊙ for TAMS. The lifetime on the main sequence of a 12.5 M⊙ star is ~1.8 × 10⁷ yr. On the other hand, the cluster IC 1805 (where LSI+61°303 is probably born) is young. Its age is estimated to be ~3 Myr (Massey et al. 1995; Sung & Lee 1995). This means that R1 is expected to be closer to the ZAMS than to the TAMS value. For the radius of the primary, Grundstrom et al. (2007a,b) adopted R1 = 6.7 ± 0.9 R⊙ from the spectral classification and Harmanec (1988) tables. This agrees with the above, and we adopted the same value.
Hanuschik (1989) gives the relation ![\begin{eqnarray} \log\, [{\it FWHM} ({\rm H}\alpha) / (1.23\; v\: \sin i \!+\! 70)] \!=\! - 0.08 \log EW + 0.14, \end{eqnarray}](/articles/aa/full_html/2013/11/aa21991-13/aa21991-13-eq45.png) (1)where FWHM and vsini are measured in km s-1, EW is in [Å] (see also Reid & Parker 2012). Using the spectra with higher S/N (S/N ≥ 60), we measured a FWHM(Hα) in the range 12.1–13.2 Å, and estimated vsini = 349 ± 6 km s-1. This agrees with the previous measurement vsini = 360 km s-1 by Hutchings & Crampton (1981).
(1)where FWHM and vsini are measured in km s-1, EW is in [Å] (see also Reid & Parker 2012). Using the spectra with higher S/N (S/N ≥ 60), we measured a FWHM(Hα) in the range 12.1–13.2 Å, and estimated vsini = 349 ± 6 km s-1. This agrees with the previous measurement vsini = 360 km s-1 by Hutchings & Crampton (1981).
4.3. Disk size
For rotationally dominated profiles the peak separation can be regarded as a measure of the outer radius of the Hα emitting disk (Huang 1972), 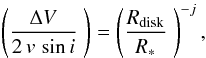 (2)with j = 0.5 for Keplerian rotation and j = 1 for the conservation of angular momentum. We adopted j = 0.5, because the kinematic evidence for Be stars points to a velocity field dominated by Keplerian rotation, with little or no radial flow (Hummel & Vrancken 2000; Hanuschik 2000; Porter & Rivinius 2003, and references therein). Equation (2) relies on the assumptions that (1) the Be star is rotating critically, and (2) that the line profile shape is dominated by kinematics, and radiative transfer does not play a role. The current view is that the Be stars rotate at values of 70–80% of the critical rate (Porter 1996; Chauville et al. 2001). Hummel & Dachs (1992) showed that at higher optical depths the emission line peaks are shifted toward lower velocities, which means smaller peak separations. Hanuschik et al. (1988) showed that the peak separation of Hα line is smaller than the peak separation of the Hβ line, and is probably smaller than the true kinematic value. Bearing in mind these effects, we used to calculate the disk radius
 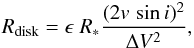 (3)where ϵ is a dimensionless parameter, for which we adopted ϵ = 0.9 ± 0.1.
Figure 2 shows the long-term variability of the EW(Hα), the distance between the red and blue peaks (ΔV), and the size of the Hα-emitting disk (Rdisk). ΔV was calculated as ΔV = Vr(R) − Vr(B), and the disk size Rd was calculated from Eq. (2).
In our observations ΔV varies in the interval 137–394 km s-1, with  km s-1, and σ(ΔV) = 30 km s-1. This, following Eq. (3), and assuming ϵ = 0.9, R∗ = 6.7, corresponds to Rdisk in the interval 15–56 R⊙, 90% of the calculated values are in the interval 21–34 R⊙, with mean
  R⊙, median ⟨ Rdisk ⟩ = 25.8 R⊙, and σ(Rdisk) = 4.4 R⊙.
4.4. ΔV versus EW
In Fig. 5 we plot ΔV versus the EW. The linear fit (of type y = a + bx) to the data points in Fig. 5 (upper panel) gives ![\begin{eqnarray} \Delta V \; \left[{\rm km\, s}^{-1}\right] = 408.3(\pm 6.0) - 6.11(\pm 0.50) \; EW \, [\AA] , \label{eq.dV.corr} \end{eqnarray}](/articles/aa/full_html/2013/11/aa21991-13/aa21991-13-eq68.png) (4)The errors of the coefficients are given in brackets. The Spearman (rho) rank correlation gives ρ = −0.47 (significance 10-9). The significance is ≪0.001, indicating that the correlation is highly significant. Equation (4) was obtained on the base of 351 data pairs obtained during the past 21 years. This correlation is much shallower when we use only the new data (Table 1), probably reflecting the fact that during the time of our new observations, the 4 yr modulation is obscured.
(4)The errors of the coefficients are given in brackets. The Spearman (rho) rank correlation gives ρ = −0.47 (significance 10-9). The significance is ≪0.001, indicating that the correlation is highly significant. Equation (4) was obtained on the base of 351 data pairs obtained during the past 21 years. This correlation is much shallower when we use only the new data (Table 1), probably reflecting the fact that during the time of our new observations, the 4 yr modulation is obscured.
The negative correlation between ΔV and EW(Hα) expresses that the outer radius grows with increasing EW(Hα) (e.g. Hanuschik et al. 1988). A similar behavior is also visible in the Hα observations of the Be/X-ray binaries LS V+ 44 17 (Reig et al. 2005) and 4U 2206 + 54 (Blay et al. 2006).
4.5. Disk truncation
Haigh et al. (2004) and Coe et al. (2006) argued that the tendency for the disk emission fluxes to cluster at specified levels is related to the presence of resonances between the disk gas and neutron star orbital periods that tend to truncate the disk at specific disk radii (Okazaki & Negueruela 2001). These truncation radii are given (see also Grundstrom et al. 2007b) by 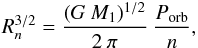 (5)where G is the gravitational constant and n is the integer number of disk gas rotational periods per one orbital period. The important resonances are not only those with n:1, but can as well be n:m in general, e.g., the 3:2 could be quite strong.
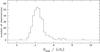 |
Fig. 6 Histogram of Rdisk values. The peak of the distribution corresponds to Rdisk ≈ 26 R⊙ (see Sect. 4.3). |
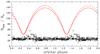 |
Fig. 7 Orbital variability of Rdisk. The solid line is the distance between the components for a neutron star, the dashed line plots the distance to a black-hole companion. Interestingly, the orbital variability of Rdisk is not in phase with the distance between the Be star and the compact object. |
Okazaki & Negueruela (2001) found that these limiting radii are defined by the closest approach of the companion in the high-eccentricity systems and by resonances between the orbital period and the disk gas rotational periods in the low-eccentricity systems. LSI+61°303 has an orbital eccentricity that falls between these two cases, where the important resonance radii are similar in size to the periastron separation.
We calculated for LSI+61°303 the resonance radii as R8 = 21.7 R⊙, R7 = 23.8 R⊙, R6 = 26.3 R⊙, R5 = 29.7 R⊙. R4 = 34.5 R⊙, and R3 = 41.8 R⊙. The peak of the histogram (Fig. 6) corresponds to Rdisk ≈ 26 R⊙, which corresponds to a 6:1 resonance. Bearing in mind the uncertainty of the adopted parameters, this peak is probably in the range R8 ≤ Rdisk ≤ R4.
The distance between the components at periastron is about r(per) ≈ 42 R⊙ for M2 = 1.4 M⊙ (r(per) ≈ 44 R⊙ for M2 = 4 M⊙). Using the Eggleton (1983) formula, we calculated a Roche lobe radius rRL = 0.57 in units of the orbital separation for M2 = 1.4 M⊙ and rRL = 0.48 for M2 = 4 M⊙, respectively. This gives for a neutron star rRL(per) = 24 R⊙ and rRL(per) = 78 R⊙ for the periastron and apastron, respectively (for a black hole these values are rRL(per) = 21 R⊙ and rRL(per) = 70 R⊙). For the circumstellar disk, it gives rRL(per) ≈ Rdisk < r(per) < rRL(ap).
For a similar system 4U 0115+63 (Porb = 24.3 d and e = 0.34), the numerical simulations of Okazaki et al. (2002) demonstraed that the surface density profile has breaks near the 5:1 resonance radius.
For the well-known X-ray pulsar 1A 0535 + 262 (HDE 245770, V725Tau), Grundstrom et al. (2007b) confirmed the expectations for resonance disk truncation. They found that the largest disk radius is similar to both the n = 5 resonance radius and the mean Roche lobe radius at the time of periastron. The historical maxima of Hα strength may imply that the disk radius can occasionally grow to even larger dimensions.
For LSI+61°303 the situation is similar. The average disk size is similar to both the n = 6 ± 1 resonance radius and the mean Roche lobe radius at the time of periastron. At times, it also grows to higher values.
4.6. Orbital variability of the Hα emission line
The best estimate of the orbital period of LSI+61°303 is Porb = 26.4960 ± 0.0028 days derived from Bayesian analysis of the radio observations (Gregory 2002). The zero phase is by convention JD0 = 2 443 366.775, the date of the first radio detection of the star (Gregory & Taylor 1978). Using this ephemeris, we plot the orbital variability of different Hα parameters in Figs. 8–10.
According to the most recent radial velocity measurements, the orbit is elliptical (e = 0.537 ± 0.034), and the periastron passage is determined to occur around phase φ = 0.275, the apastron passage at φ = 0.775, the superior conjunction at φ = 0.081 (NS behind the B0V) and inferior conjunction (the NS passes in front of the B0V star) at φ = 0.313 (Aragona et al. 2009). The eccentricity and relatively short orbital period provide significant changes in physical conditions along the orbit.
The orbital modulation is better visible in the ratio EW(B)/EW(R), EW(B) and Vr(cd). The highest-values EW(B)/EW(R) > 1.0 are reached in the orbital phase interval 0.13–0.43 when the neutron star is on the left side (relatively to the line of sight) and moves toward the observer. The highest values of the EW(B) are reached in the phase interval 0.3–0.6, the highest values of the total EW(Hα) are also reached in the phase interval 0.3–0.6, where the minimum of ΔV and the maximum of Rdisk occur as well.
The peak radio emission in each orbit occurs somewhere in range of phases extending from 0.4 to 0.9 (Gregory 2002). The onset of the outburst is ~0.1−0.15 earlier (Zamanov & Martí 2000). This means that the maxima of EW(Hα) and EW(B) occur more or less at the time of the start of the radio outbursts.
One might expect that the disk size varies in phase with the distance between the Be star and the compact object. However, this is not the case in LSI+61°303. Rdisk is not in phase with the distance between the Be star and the compact object. The peak of the disk size occurs in the interval 0.3–0.6, that is, it preceedes the apastron, which occurs at φ = 0.775 (see Figs. 7 and 9). This could be due to size variation and/or some tidal noncircular motion in the disk (e.g. Fig. 1 of Romero et al. 2007).
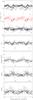 |
Fig. 8 Hα parameters folded with orbital period. The following parameters are plotted (from up to down): radial velocity of the blue peak, radial velocity of the red peak, B/R ratio, the ratio of the equivalent widths of the blue and red peak, the equivalent width of the red peak, and the equivalent width of the blue peak. The radial velocities are those after JD 2 448 868. |
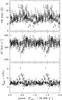 |
Fig. 9 EW, ΔV, and Rdisk folded with a period of 26.496 d. |
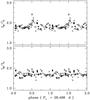 |
Fig. 10 Intensity of the red and blue peak of Hα folded with orbital period. The orbital modulation is visible in IR. These values are measured on our new spectra. |
5. Discussion
The circumstellar disks of the Be stars are inherently time variable and can develop and disappear on timescales of years to decades (Underhill & Doazan 1982; Hubert & Floquet 1998). Disk-loss episodes has been observed in the BeXRBs X Per (Roche et al. 1997) and 1A 0535+262 (Haigh et al. 2000). For LSI+61°303 there are Hα observations for more then 20 yr, during which period no disk-loss episode has been observed. The existence of Hα in emission throughout the past 24 years suggests that there is a permanent gas disk around the Be star.
5.1. Orbital modulation of the EW(Hα) in Be/γ-ray binaries
Tarasov et al. (2003) demonstrated that the Hα line-profiles of the supergiant X-ray binary Cyg X-1 show a complex variability on different timescales, controlled in particular by the orbital period and the focused wind model of the mass loss.
In our observations the EW(Hα) peaks at orbital phase φ ~ 0.4−0.7 (see Fig. 9). The detailed study of the Hα emission of LSI+61°303 throughout an entire, single orbit (McSwain et al. 2010) demonstrated that there is a well-pronounced peak in EW(Hα) at orbital phases 0.5−0.7. Bearing in mind that the periastron passage is at φ = 0.275, we conclude that the EW(Hα) peaks at 0.2–0.4 phases past periastron.
Casares et al. (2012a) reported spectroscopic observations of the two γ-ray binaries MWC 656 (AGL J2241+4454) and MWC 148 (HESS J0632+057). For MWC 656 (B3IV primary, Porb = 60.37 d, e ~ 0.40), they detected a maximum of the EW(Hα) at 0.3 phases past periastron, for MWC 148 (primary B0Ve, Porb = 321 d, e ≈ 0.83), with the correct phasing (see Casares et al. 2012b), the maximum in the EW of the Hα line occurs ~0.5 orbital phases past periastron.
Apparently it is a common property of the Be/γ-ray binaries that the maximum of the EW(Hα) occurs with a delay of 0.3–0.5 phases past periastron.
5.2. Rotation of the components
Be stars are fast rotators. They rotate at 70–80% of the critical rate with a rather small intrinsic width of the distribution (Porter & Rivinius 2003, and references therein). The properties of the Be binaries with detected hot evolved companions demonstrate that some fraction of Be stars were spun up through angular-momentum transfer by Roche-lobe overflow (Peters et al. 2013). This is probably also the case for most of the Be/X-ray binaries. The rotation period of the primary in LSI+61°303 (B0Ve star) is estimated to be Prot ~ 0.4−2.6 d, which means that it has a ratio Prot/Porb ~ 0.05, one of the higher values among the Be/X-ray binaries (Stoyanov & Zamanov 2010).
The spin period of the compact object in LSI+61°303 is still unknown. The deep searches in the radio- (McSwain et al. 2011; Cañellas et al. 2012) and X-ray band (Rea et al. 2010) did not detect pulsed fraction so far. The ejector-propeller model of LSI+61°303 predicts a spin period of the neutron star of 0.15–0.20 s (Zamanov 1995; Zamanov et al. 2001). One more prediction can be made using the Corbet diagram (Corbet 1986). The equation log Pspin = −1.011 + 1.447log Porb (where Pspin is in seconds, Porb is in days), which seems to be valid for wind-fed sources (X-ray pulsars in Be/X-ray binaries and white dwarfs in symbiotic stars), predicts Pspin ≈ 11 s.
5.3. Shell criterion and the Be star inclination
The Be-shell stars are identified as normal Be stars viewed edge-on (Porter 1996; Rivinius et al. 2006). Comparing the FeII and Hα line profile, Hanuschik (1996) found that the shell stars are those with Ip/Icd(Hα) ≥ 1.5, where Ip and Icd are the mean peak intensity and the intensity of the central depression, respectively.
In our spectroscopic observations of LSI+61°303, Ip/Icd(Hα) varies in the range 1.16–1.70. Removing the four highest and four lowest values, we obtain a range of 1.20–1.53, a mean value of 1.40, and a standard deviation of the mean 0.08. It falls in the intermediate cases according to Eq. (3) of Hanuschik (1996). Among our 130 measurements there are about a dozen values with Ip/Icd ≥ 1.5, and the Be star of LSI+61°303 fulfills the shell criterion (e.g. 1998/10/04, 2012/07/07). The spectrum 20120707164 is plotted in the bottom panel of Fig. 1 and it is visible that the central dip of Hα intensifies and the central absorption of HeIλ6678 deepens as well. The specific effect of the transition to the Be-shell type is expected only at about an inclination angle i ≈ 70° ± 5° (Hanuschik 1996). This suggests that the inclination of the primary star in LSI+61°303 to the line of sight is probably i ~ 70°.
One more clue for the inclination can be given using the full width at zero intensity (FWZI). For an optically thin line this is connected with the inclination, FWZI/2 × sini = (GM1/R1)1/2 (see Casares et al. 2012a, and references therein). The FWZI of the Hα line is ~60 Å, but it is not optically thin and other mechanisms are broadening it. The FWZI of HeIλ6678 line is 19.0(± 10%) Å, which points again to a high inclination i ~ 90°.
5.4. Connection between Hα and high-energy emission
The nonthermal behavior of the source has been studied often, but is still poorly understood. The nonthermal radio emission presents a well-defined periodicity with strong flares that occur periodically near apastron passage, along with an additional modulation on a 4.6 year timescale (Gregory 2002). The detection of extended structures in radio observations originally identified LS I +61° 303 as a potential microquasar, with high-energy emission produced in jets driven by accretion onto the compact object, presumably a black hole (Massi et al. 2001). However, high-resolution VLBA observations indicate that the radio structures are not persistent and can be more easily explained by the interaction between a pulsar wind and the wind of the stellar companion (Dhawan et al. 2006; Albert et al. 2008), although alternative interpretations are still possible (Romero et al. 2007; Massi & Zimmerman 2010). Many arguments in favor of LS I +61°303 as a nonaccreting pulsar system have been summarized by Torres et al. (2010). The high-energy process that causes the very high energy emission could also produce neutrino flux. No evidence for periodic neutrino emission is found in the IceCube Neutrino Observatory data (Abbasi et al. 2012) until now.
5.4.1. Connection between Hα and γ-rays
The gamma-ray flux (>0.1 GeV) also displays orbital modulation. Its maximum is at orbital phases 0.35–0.55 and the minimum at 0.9–1.0 (Hadasch et al. 2012). The maximum of the gamma-ray flux coincides with the maxima of the EW(Hα), EW(B), and Rdisk (see also Fig. 9). The minimum of the gamma-ray flux corresponds to the minima of EW(Hα) and EW(B).
A flux change in gamma rays (Hadasch et al. 2012) occurred in March 2009 (around JD 2 454 900). Before the transition, the modulation was clearly visible and was compatible with the previously published phasogram, whereas afterwards, the amplitude of the modulation diminished. This transition in gamma-rays corresponds to a minimum value of the EW(Hα). On February 6, 2009 we observed an EW(Hα) = 7.8 Å, which is considerably below the average value (see also Fig. 2). This is approximately the minimum of 1600-day modulation of the EW(Hα).
5.4.2. Connection between Hα and X-rays
Torres et al. (2010) showed that the soft-X-ray emission from LSI+61°303 presents a periodic behavior at the orbital period, with a varying shape. Profile variability is seen from orbit to orbit on a multi-year timescale. In their analysis the orbital peak of the soft X-rays (see Fig. 2 of Torres et al. 2010) is at phases 0.4–0.7. This coincides well with the EW, EW(B) and ΔV peaks, which occur at the same orbital phases φ ~ 0.4−0.7 (see Fig. 9).
Simultaneous X-ray and radio observations show that periodic radio flares always lag the X-ray flare by Δφ ≃ 0.2 (Chernyakova et al. 2012), a behavior predicted by the ejector – propeller model. Additionally, intense X-ray flares have been observed (Smith et al. 2009; Torres et al. 2010), during which the flux increased by up to a factor of five and variability on a timescale of a few seconds was observed. But because of the relatively large RXTE-PCA field-of-view (~1° FWHM), it cannot be ruled out that these flares are caused by an unrelated source in the same field. If such flares are generated in LSI+61°303, they are probably the reason for the dramatic decline in the Hα emission observed in October 1999, which may have been caused by a sudden ionization of the disk (see Grundstrom et al. 2007a).
6. Conclusions
We summarize the main results of our spectral observations of the Be/X-ray binary LSI+61°303 as follows:
-
1.
We measured various parameters of theHα emission line – equivalent widths, radialvelocities, and intensities.
-
2.
The periodogram analysis confirmed that the Hα emission is modulated with the orbital and superorbital periods. The values are practically identical to those detected in the radio observations.
-
3.
For the past 20 years the radius of the circumstellar disk is similar to the Roche lobe radius at periastron. It is probably truncated by a resonance of n = 6 ± 1.
-
4.
The orbital maxima of the equivalent width of Hα emission and the radius of the circumstellar disk peak after the periastron and coincide on average with the X-ray and γ-ray maxima.
-
5.
For the B0V primary, we estimated a projected rotational velocity vsini = 349 ± 8 km s-1. Its inclination to the line of sight is probably about 70°.
In future it will be interesting to compare the Hα variability of LSI+61°303 in detail with the variation in X-rays and γ-rays.
Acknowledgments
We thank the anonymous referee for constructive comments. This work was supported in part by the OP “HRD”, ESF and Bulgarian Ministry of Education, Youth and Science under the contract BG051PO001-3.3.06-0047. J.M. and P.L.L.E. acknowledge support by grant AYA2010-21782-C03-03 from the Spanish Government, and Consejería de Economía, Innovación y Ciencia of Junta de Andalucía as research group FQM-322, as well as FEDER funds.
References
- Abbasi, R., Abdou, Y., Abu-Zayyad, T., et al. 2012, ApJ, 748, 118 [NASA ADS] [CrossRef] [Google Scholar]
- Abdo, A. A., Ackermann, M., Ajello, M., et al. 2009, ApJ, 701, L123 [NASA ADS] [CrossRef] [Google Scholar]
- Acciari, V. A., Beilicke, M., Blaylock, G., et al. 2008, ApJ, 679, 1427 [NASA ADS] [CrossRef] [Google Scholar]
- Albert, J., Aliu, E., Anderhub, H., et al. 2006, Science, 312, 1771 [NASA ADS] [CrossRef] [PubMed] [Google Scholar]
- Albert, J., Aliu, E., Anderhub, H., et al. 2008, ApJ, 684, 1351 [NASA ADS] [CrossRef] [Google Scholar]
- Apparao, K. M. V. 2001, A&A, 371, 672 [NASA ADS] [CrossRef] [EDP Sciences] [Google Scholar]
- Aragona, C., McSwain, M. V., Grundstrom, E. D., et al. 2009, ApJ, 698, 514 [NASA ADS] [CrossRef] [Google Scholar]
- Balona, L. A. 2000, IAU Colloq. 175, The Be Phenomenon in Early-Type Stars, 214, 1 [Google Scholar]
- Bignami, G. F., Caraveo, P. A., Lamb, R. C., Markert, T. H., & Paul, J. A. 1981, ApJ, 247, L85 [NASA ADS] [CrossRef] [Google Scholar]
- Bildsten, L., Chakrabarty, D., Chiu, J., et al. 1997, ApJS, 113, 367 [NASA ADS] [CrossRef] [Google Scholar]
- Blay, P., Negueruela, I., Reig, P., et al. 2006, A&A, 446, 1095 [NASA ADS] [CrossRef] [EDP Sciences] [Google Scholar]
- Cañellas, A., Joshi, B. C., Paredes, J. M., et al. 2012, A&A, 543, A122 [NASA ADS] [CrossRef] [EDP Sciences] [Google Scholar]
- Casares, J., Ribó, M., Ribas, I., et al. 2012a, MNRAS, 421, 1103 [NASA ADS] [CrossRef] [Google Scholar]
- Casares, J., Ribó, M., Ribas, I., et al. 2012b, MNRAS, 426, 796 [NASA ADS] [CrossRef] [Google Scholar]
- Chauville, J., Zorec, J., Ballereau, D., et al. 2001, A&A, 378, 861 [NASA ADS] [CrossRef] [EDP Sciences] [Google Scholar]
- Chernyakova, M., Neronov, A., Molkov, S., et al. 2012, ApJ, 747, L29 [NASA ADS] [CrossRef] [Google Scholar]
- Coe, M. J., Reig, P., McBride, V. A., Galache, J. L., & Fabregat, J. 2006, MNRAS, 368, 447 [NASA ADS] [CrossRef] [Google Scholar]
- Corbet, R. H. D. 1986, MNRAS, 220, 1047 [NASA ADS] [CrossRef] [Google Scholar]
- Demircan, O., & Kahraman, G. 1991, Ap&SS, 181, 313 [NASA ADS] [CrossRef] [Google Scholar]
- Dhawan, V., Mioduszewski, A., & Rupen, M. 2006, VI Microquasar Workshop: Microquasars and Beyond [Google Scholar]
- Eggleton, P. P. 1983, ApJ, 268, 368 [NASA ADS] [CrossRef] [Google Scholar]
- Gregory, P. C. 2002, ApJ, 575, 427 [NASA ADS] [CrossRef] [Google Scholar]
- Gregory, P. C., & Taylor, A. R. 1978, Nature, 272, 704 [NASA ADS] [CrossRef] [Google Scholar]
- Gregory, P. C., Taylor, A. R., Crampton, D., et al. 1979, AJ, 84, 1030 [NASA ADS] [CrossRef] [Google Scholar]
- Gregory, P. C., Xu, H.-J., Backhouse, C. J., & Reid, A. 1989, ApJ, 339, 1054 [Google Scholar]
- Greiner, J., & Rau, A. 2001, A&A, 375, 145 [NASA ADS] [CrossRef] [EDP Sciences] [Google Scholar]
- Grundstrom, E. D., Caballero-Nieves, S. M., Gies, D. R., et al. 2007a, ApJ, 656, 437 [NASA ADS] [CrossRef] [Google Scholar]
- Grundstrom, E. D., Boyajian, T. S., Finch, C., et al. 2007b, ApJ, 660, 1398 [NASA ADS] [CrossRef] [Google Scholar]
- Hadasch, D., Torres, D. F., Tanaka, T., et al. 2012, ApJ, 749, 54 [NASA ADS] [CrossRef] [Google Scholar]
- Haigh, N. J., Coe, M. J., Steele, I. A., & Fabregat, J. 2000, in IAU Colloq. 175, The Be Phenomenon in Early-Type Stars, ASP Conf. Proc., 214, 735 [NASA ADS] [Google Scholar]
- Haigh, N. J., Coe, M. J., & Fabregat, J. 2004, MNRAS, 350, 1457 [NASA ADS] [CrossRef] [Google Scholar]
- Hanuschik, R. W. 1989, Ap&SS, 161, 61 [NASA ADS] [CrossRef] [Google Scholar]
- Hanuschik, R. W. 1996, A&A, 308, 170 [NASA ADS] [Google Scholar]
- Hanuschik, R. W. 2000, in IAU Colloq. 175, The Be Phenomenon in Early-Type Stars, ASP Conf. Proc., 214, 518 [Google Scholar]
- Hanuschik, R. W., Kozok, J. R., & Kaiser, D. 1988, A&A, 189, 147 [NASA ADS] [Google Scholar]
- Harrison, F. A., Ray, P. S., Leahy, D. A., Waltman, E. B., & Pooley, G. G. 2000, ApJ, 528, 454 [NASA ADS] [CrossRef] [Google Scholar]
- Hermsen, W., Swanenburg, B. N., Bignami, G. F., et al. 1977, Nature, 269, 494 [NASA ADS] [CrossRef] [Google Scholar]
- Huang, S.-S. 1972, ApJ, 171, 549 [NASA ADS] [CrossRef] [Google Scholar]
- Hubert, A. M., & Floquet, M. 1998, A&A, 335, 565 [NASA ADS] [Google Scholar]
- Hummel, W., & Dachs, J. 1992, A&A, 262, L17 [NASA ADS] [Google Scholar]
- Hummel, W., & Vrancken, M. 2000, A&A, 359, 1075 [NASA ADS] [Google Scholar]
- Hutchings, J. B., & Crampton, D. 1981, PASP, 93, 486 [NASA ADS] [CrossRef] [Google Scholar]
- Leahy, D. A. 2001, Int. Cosmic Ray Conf., 6, 2524 [NASA ADS] [Google Scholar]
- Li, J., Torres, D. F., Zhang, S., et al. 2012, ApJ, 744, L13 [NASA ADS] [CrossRef] [Google Scholar]
- Liu, Q. Z., & Yan, J. Z. 2005, New A, 11, 130 [Google Scholar]
- Massi, M., & Zimmermann, L. 2010, A&A, 515, A82 [NASA ADS] [CrossRef] [EDP Sciences] [Google Scholar]
- Massi, M., Ribó, M., Paredes, J. M., Peracaula, M., & Estalella, R. 2001, A&A, 376, 217 [NASA ADS] [CrossRef] [EDP Sciences] [Google Scholar]
- Massi, M., Ribó, M., Paredes, J. M., et al. 2004, A&A, 414, L1 [NASA ADS] [CrossRef] [EDP Sciences] [Google Scholar]
- Massi, M., Ros, E., & Zimmermann, L. 2012, A&A, 540, A142 [NASA ADS] [CrossRef] [EDP Sciences] [Google Scholar]
- McSwain, M. V., Grundstrom, E. D., Gies, D. R., & Ray, P. S. 2010, ApJ, 724, 379 [NASA ADS] [CrossRef] [Google Scholar]
- McSwain, M. V., Ray, P. S., Ransom, S. M., et al. 2011, ApJ, 738, 105 [NASA ADS] [CrossRef] [Google Scholar]
- Mendelson, H., & Mazeh, T. 1994, MNRAS, 267, 1 [NASA ADS] [Google Scholar]
- Mirabel, I. F., Rodrigues, I., & Liu, Q. Z. 2004, A&A, 422, L29 [NASA ADS] [CrossRef] [EDP Sciences] [Google Scholar]
- Okazaki, A. T., & Negueruela, I. 2001, A&A, 377, 161 [NASA ADS] [CrossRef] [EDP Sciences] [Google Scholar]
- Paredes, J. M. 1987, Ph.D. Thesis, Universitat de Barcelona [Google Scholar]
- Paredes, J. M., Marziani, P., Martí, J., et al. 1994, A&A, 288, 519 [NASA ADS] [Google Scholar]
- Paredes, J. M., Martí, J., Peracaula, M., & Ribo, M. 1997, A&A, 320, L25 [NASA ADS] [Google Scholar]
- Paredes, J. M., Bednarek, W., Bordas, P., et al. 2013, APh, 43, 301 [Google Scholar]
- Peters, G. J., Pewett, T. D., Gies, D. R., Touhami, Y. N., & Grundstrom, E. D. 2013, ApJ, 765, 2 [NASA ADS] [CrossRef] [Google Scholar]
- Porter, J. M. 1996, MNRAS, 280, L31 [NASA ADS] [CrossRef] [Google Scholar]
- Porter, J. M., & Rivinius, T. 2003, PASP, 115, 1153 [NASA ADS] [CrossRef] [Google Scholar]
- Punsly, B. 1999, ApJ, 519, 336 [NASA ADS] [CrossRef] [Google Scholar]
- Rea, N., Torres, D. F., van der Klis, M., et al. 2010, MNRAS, 405, 2206 [NASA ADS] [Google Scholar]
- Reid, W. A., & Parker, Q. A. 2012, MNRAS, 425, 355 [NASA ADS] [CrossRef] [Google Scholar]
- Reig, P. 2011, Ap&SS, 332, 1 [NASA ADS] [CrossRef] [Google Scholar]
- Reig, P., Fabregat, J., & Coe, M. J. 1997, A&A, 322, 193 [NASA ADS] [Google Scholar]
- Reig, P., Negueruela, I., Fabregat, J., Chato, R., & Coe, M. J. 2005, A&A, 440, 1079 [NASA ADS] [CrossRef] [EDP Sciences] [Google Scholar]
- Rivinius, T., Štefl, S., & Baade, D. 2006, A&A, 459, 137 [NASA ADS] [CrossRef] [EDP Sciences] [Google Scholar]
- Roberts, D. H., Lehar, J., & Dreher, J. W. 1987, AJ, 93, 968 [NASA ADS] [CrossRef] [Google Scholar]
- Roche, P., Larionov, V., Tarasov, A. E., et al. 1997, A&A, 322, 139 [NASA ADS] [Google Scholar]
- Romero, G. E., Okazaki, A. T., Orellana, M., & Owocki, S. P. 2007, A&A, 474, 15 [NASA ADS] [CrossRef] [EDP Sciences] [Google Scholar]
- Slettebak, A. 1988, PASP, 100, 770 [NASA ADS] [CrossRef] [Google Scholar]
- Smith, A., Kaaret, P., Holder, J., et al. 2009, ApJ, 693, 1621 [NASA ADS] [CrossRef] [Google Scholar]
- Steele, I. A., Coe, M. J., Fabregat, J., et al. 1996, A&AS, 120, 213 [NASA ADS] [Google Scholar]
- Stellingwerf, R. F. 1978, ApJ, 224, 953 [NASA ADS] [CrossRef] [Google Scholar]
- Stoyanov, K. A., & Zamanov, R. K. 2009, Astron. Nachr., 330, 727 [NASA ADS] [CrossRef] [Google Scholar]
- Sung, H., & Lee, S.-W. 1995, J. Korean Astron. Soc., 28, 119 [Google Scholar]
- Tarasov, A. E., Brocksopp, C., & Lyuty, V. M. 2003, A&A, 402, 237 [NASA ADS] [CrossRef] [EDP Sciences] [Google Scholar]
- Taylor, A. R., Kenny, H. T., Spencer, R. E., & Tzioumis, A. 1992, ApJ, 395, 268 [NASA ADS] [CrossRef] [Google Scholar]
- Torres, D. F., Zhang, S., Li, J., et al. 2010, ApJ, 719, L104 [NASA ADS] [CrossRef] [Google Scholar]
- Underhill, A., & Doazan, V. 1982, B Stars with and without emission lines (NASA SP-456) [Google Scholar]
- Zaitseva, G. V., & Borisov, G. V. 2003, Astron. Lett., 29, 188 [NASA ADS] [CrossRef] [Google Scholar]
- Zamanov, R., & Martí, J. 2000, A&A, 358, L55 [NASA ADS] [Google Scholar]
- Zamanov, R., Marti, J., & Marziani, P. 2001, The Second National Conference on Astrophysics of Compact Objects, 50 [arXiv:astro-ph/0110114] [Google Scholar]
- Zamanov, R. K. 1995, MNRAS, 272, 308 [NASA ADS] [CrossRef] [Google Scholar]
- Zamanov, R. K., Martí, J., Paredes, J. M., et al. 1999, A&A, 351, 543 [NASA ADS] [Google Scholar]
All Figures
|
Fig. 1 Three examples of Hα profiles. The upper spectrum is taken from the time of maximal EW = 18.2 Å (19 960 825). The middle spectrum has a EW = 13.1 Å (2 000 917). The lower spectrum (20 120 707, EW = 10.8) is taken at a moment when the star fulfilled the shell criterion (see also Sect. 5.3). |
| In the text | |
|
Fig. 2 Long-term variability of the equivalent width EW(Hα), the distance between the peaks of the Hα emission line, and the calculated radius of the Hα-emitting circumstellar disk. The arrow in the upper panel corresponds to the time of the γ-ray flux transition (see also Sect. 5.4.1). |
| In the text | |
|
Fig. 3 Periodograms for the ratio EWB/EWR of LSI+61°303. They are computed using the PDM and CLEAN methods. The orbital period is detected in both cases as the most significant one. |
| In the text | |
|
Fig. 4 Results of harmonic fit to the EW data, which clearly show the orbital period and a 4.5 yr long-term modulation. |
| In the text | |
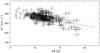 |
Fig. 5 ΔV versus EW. The solid line is the best linear fit (see Eq. (4)). |
| In the text | |
|
Fig. 6 Histogram of Rdisk values. The peak of the distribution corresponds to Rdisk ≈ 26 R⊙ (see Sect. 4.3). |
| In the text | |
|
Fig. 7 Orbital variability of Rdisk. The solid line is the distance between the components for a neutron star, the dashed line plots the distance to a black-hole companion. Interestingly, the orbital variability of Rdisk is not in phase with the distance between the Be star and the compact object. |
| In the text | |
|
Fig. 8 Hα parameters folded with orbital period. The following parameters are plotted (from up to down): radial velocity of the blue peak, radial velocity of the red peak, B/R ratio, the ratio of the equivalent widths of the blue and red peak, the equivalent width of the red peak, and the equivalent width of the blue peak. The radial velocities are those after JD 2 448 868. |
| In the text | |
|
Fig. 9 EW, ΔV, and Rdisk folded with a period of 26.496 d. |
| In the text | |
|
Fig. 10 Intensity of the red and blue peak of Hα folded with orbital period. The orbital modulation is visible in IR. These values are measured on our new spectra. |
| In the text | |
Current usage metrics show cumulative count of Article Views (full-text article views including HTML views, PDF and ePub downloads, according to the available data) and Abstracts Views on Vision4Press platform.
Data correspond to usage on the plateform after 2015. The current usage metrics is available 48-96 hours after online publication and is updated daily on week days.
Initial download of the metrics may take a while.