Fig. 5
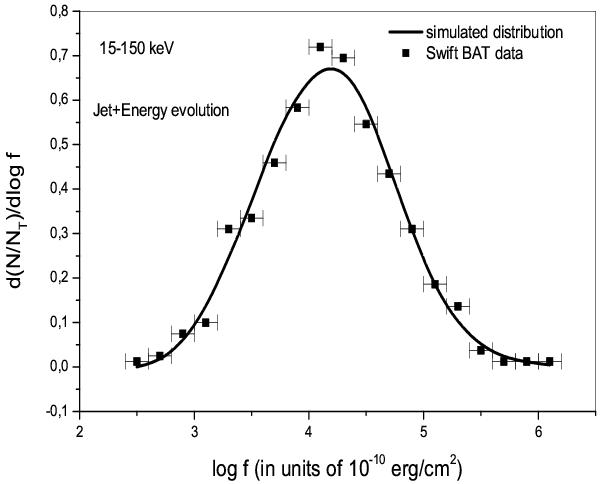
Fluence frequency distribution for the jet model including energy evolution (δ = 0.5). Points correspond to Swift-BAT data as in Fig. 1. The solid curve was derived from simulations using a log-normal distribution for the jet energy distribution in which the median varies linearly with the redshift.
Current usage metrics show cumulative count of Article Views (full-text article views including HTML views, PDF and ePub downloads, according to the available data) and Abstracts Views on Vision4Press platform.
Data correspond to usage on the plateform after 2015. The current usage metrics is available 48-96 hours after online publication and is updated daily on week days.
Initial download of the metrics may take a while.