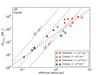
Fig. 7
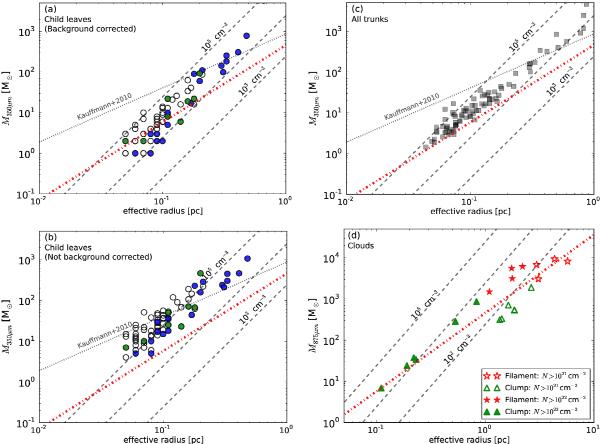
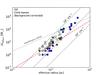
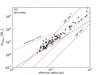
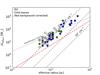
a) Child leaf mass (corrected for the parent flux contribution) as a function of effective radius (reff =  ). The blue and green filled circles are the leaves recovered as PACS and cold cores, respectively, and open circles have no Herschel counterpart. The masses are calculated using the best fit temperatures, or the upper limit temperatures for leaves with no Herschel counterpart. The dashed gray lines are loci of constant number density, and the dashed-dotted red line is Larson’s mass-size relation (Larson 1981), which is approximately a line of constant column density, NH2 = 1022 cm-2. b) Same as a), but the leaf mass is not corrected for parent flux contribution. c) Total mass in each trunk, no flux correction, as a function of effective radius. d) Total cloud mass from the ATLASGAL survey maps as a function of effective radius, computed for the area above 1021 cm-2 (empty symbols) and 1022 cm-2 (filled symbols). Filamentary clouds are plotted in red stars and clumpy clouds are plotted in green triangles. Note that the axis scales in d) differ from a) through c).
Current usage metrics show cumulative count of Article Views (full-text article views including HTML views, PDF and ePub downloads, according to the available data) and Abstracts Views on Vision4Press platform.
Data correspond to usage on the plateform after 2015. The current usage metrics is available 48-96 hours after online publication and is updated daily on week days.
Initial download of the metrics may take a while.