Fig. 14
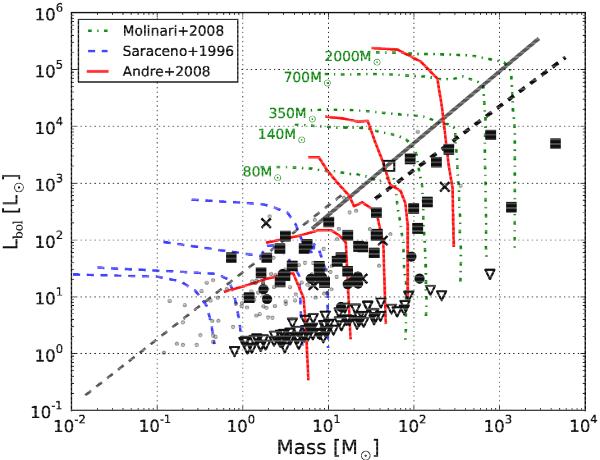
Same as Fig. 13 (our data are shown in the corresponding black symbols for clarity), but with various evolutionary models overplotted. In red solid lines are the André et al. (2008) tracks for final stellar masses of 1, 3, 8, 15, and 50 M⊙ (left to right). The Saraceno et al. (1996) tracks for initial masses of 0.5, 1, 2, and 4 M⊙ are shown in blue dashed lines, and the Molinari et al. (2008) tracks for initial envelope masses 80, 140, 350, 700, and 2000 M⊙ are shown in green dashed-dotted lines. The diagonal lines are the same loci fitting the Class I-like sources (gray dashed and solid) and “MM”, Class 0-like soures (dashed black) as in Fig. 13.
Current usage metrics show cumulative count of Article Views (full-text article views including HTML views, PDF and ePub downloads, according to the available data) and Abstracts Views on Vision4Press platform.
Data correspond to usage on the plateform after 2015. The current usage metrics is available 48-96 hours after online publication and is updated daily on week days.
Initial download of the metrics may take a while.