Fig. 13
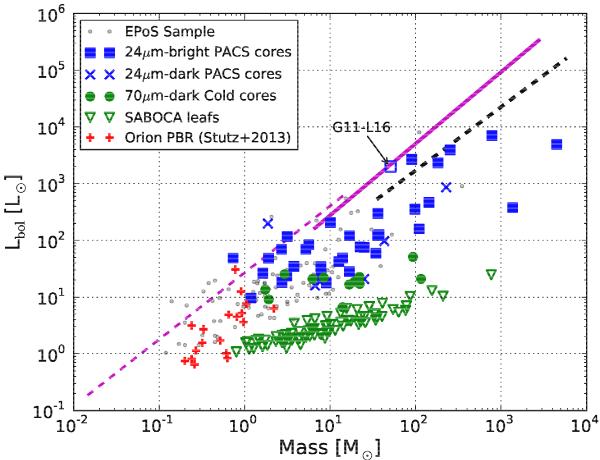
Lbol-Mass diagram for all cores in the EPoS sample (R12) (gray dots), those protostellar cores (70 μm-bright) recovered by SABOCA (blue squares), candidate starless cores (70 μm-dark cold cores, green circles). The M350 μm (at the upper limit temperature) and upper limit to Lbol are plotted in the empty green triangles, also candidate starless objects. The UCHII region in IRDC 011.11 (Leaf 16) is indicated in the empty blue square. We plot the Orion PBR sample (Stutz et al. 2013) for comparison in red crosses. The magenta lines are the empirical boundaries between “Class 0”-like (below line) and “Class II”-like (above line) found for high-mass (solid magenta line Molinari et al. 2008) and low-mass (thin dashed magenta line Saraceno et al. 1996). The black dashed line is the empirical fit to the Molinari et al. (2008) “MM” sources, analogous to Class 0 in the low-mass regime. See text for details.
Current usage metrics show cumulative count of Article Views (full-text article views including HTML views, PDF and ePub downloads, according to the available data) and Abstracts Views on Vision4Press platform.
Data correspond to usage on the plateform after 2015. The current usage metrics is available 48-96 hours after online publication and is updated daily on week days.
Initial download of the metrics may take a while.