Fig. 12
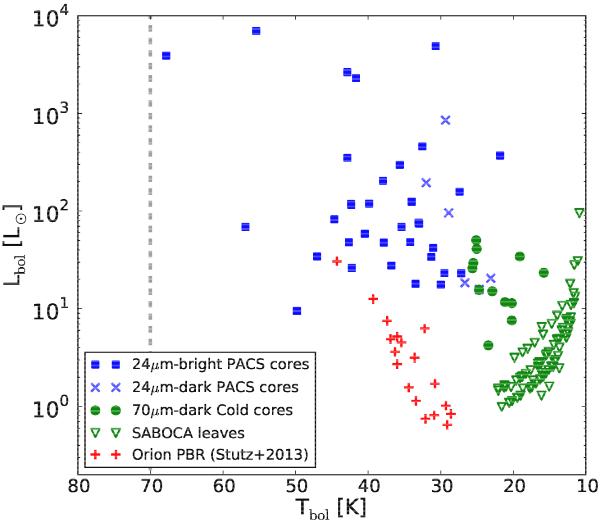
Bolometric luminosity (Lbol) plotted as a function of bolometric temperature (Tbol). The cores detected in all PACS bands are plotted in blue (squares for 24 μm-bright, × for 24 μm-dark), and the 70 μm-dark “cold cores” are plotted in filled green circles. The green triangles represent upper limits for objects which were detected only at 350 μm with SABOCA. For comparison, the PACS bright red objects (PBRs) in Orion (Stutz et al. 2013) are shown in red crosses. The dividing line between Class I and Class 0 defined for low-mass protostars at 70 K (André et al. 1993) is shown for reference.
Current usage metrics show cumulative count of Article Views (full-text article views including HTML views, PDF and ePub downloads, according to the available data) and Abstracts Views on Vision4Press platform.
Data correspond to usage on the plateform after 2015. The current usage metrics is available 48-96 hours after online publication and is updated daily on week days.
Initial download of the metrics may take a while.