Fig. 1
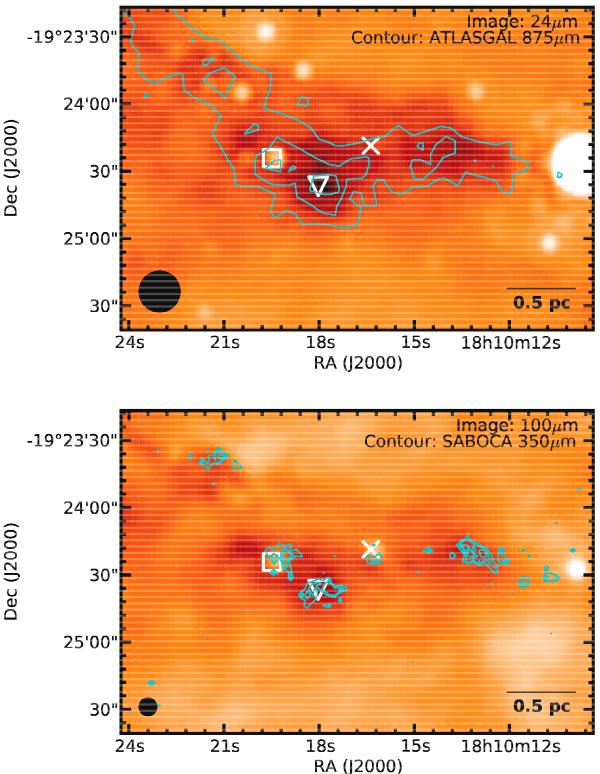
Top: 24 μm image of region in IRDC011.11−0.12 with ATLASGAL 875 μm contours. The 19.2″ ATLASGAL beam at this wavelength is shown in the lower-left corner. Bottom: PACS 100 μm image of the same region over-plotted with SABOCA 350 μm contours. The 7.8″ SABOCA beam is shown at the lower-left corner. The square marks the position of a 24 μm-bright protostar; the × marks the position of a 24 μm-dark protostar; the triangle marks an IR-dark core.
Current usage metrics show cumulative count of Article Views (full-text article views including HTML views, PDF and ePub downloads, according to the available data) and Abstracts Views on Vision4Press platform.
Data correspond to usage on the plateform after 2015. The current usage metrics is available 48-96 hours after online publication and is updated daily on week days.
Initial download of the metrics may take a while.