Fig. 8
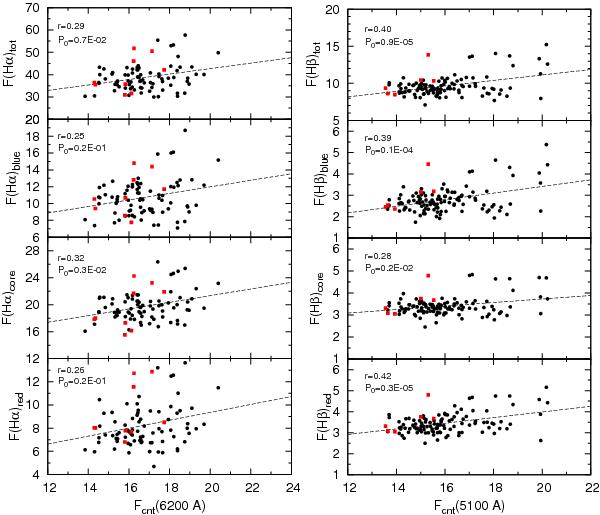
Hα and Hβ line and their line-segment fluxes (blue wing, line core, red wing) vs. the continuum flux at 6300 and 5100, respectively. The continuum flux is plotted in units of 10-16 erg cm-2 s-1 A-1, the line-segment fluxes in units of 10-14 erg cm-2 s-1. The correlation coefficient and the corresponding p-value are given in the upper left corner. The CA-data are denoted with squares.
Current usage metrics show cumulative count of Article Views (full-text article views including HTML views, PDF and ePub downloads, according to the available data) and Abstracts Views on Vision4Press platform.
Data correspond to usage on the plateform after 2015. The current usage metrics is available 48-96 hours after online publication and is updated daily on week days.
Initial download of the metrics may take a while.