Free Access
Fig. 6
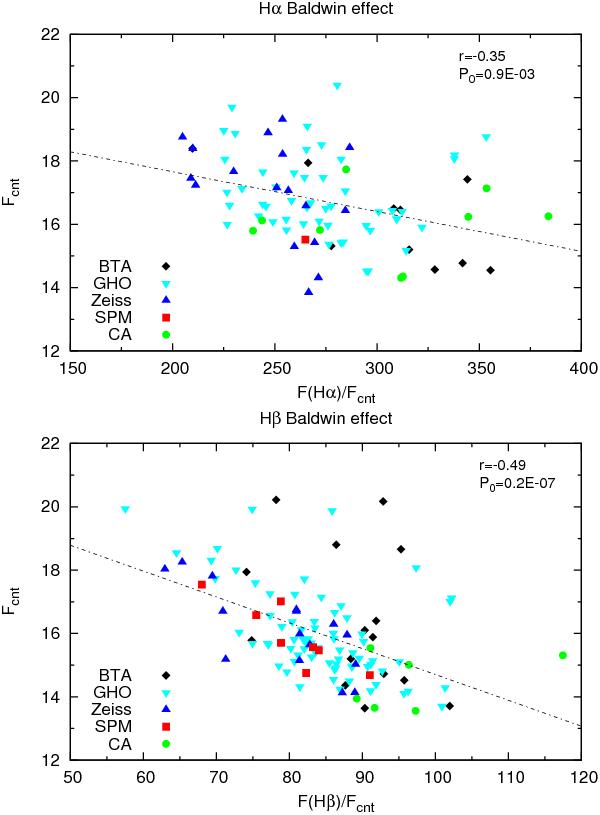
Baldwin effect in the Hα (upper panel) and Hβ line (bottom panel). The continuum flux is plotted in units of 10-16 erg cm-2 s-1 Å-1. Observations with different telescopes are denoted with different symbols given in the bottom left corner. The correlation coefficient and the corresponding p-value are also given.
This figure is made of several images, please see below:
Current usage metrics show cumulative count of Article Views (full-text article views including HTML views, PDF and ePub downloads, according to the available data) and Abstracts Views on Vision4Press platform.
Data correspond to usage on the plateform after 2015. The current usage metrics is available 48-96 hours after online publication and is updated daily on week days.
Initial download of the metrics may take a while.