Fig. 3
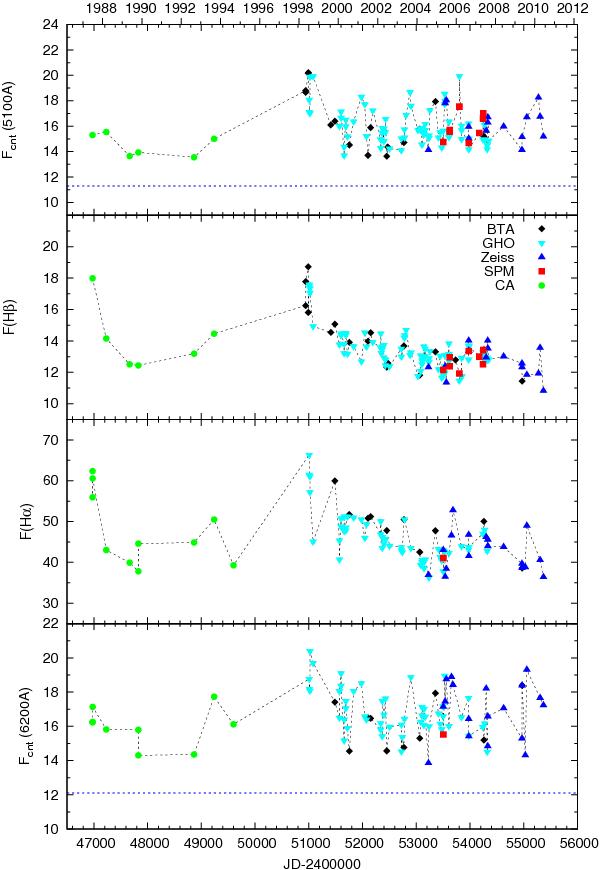
Light-curves (from top to bottom) for the blue continuum flux, the Hβ and Hα line flux, and the red continuum flux. Observations with different telescopes are denoted with different symbols given in the middle plot. The continuum flux is plotted in units of 10-16 erg cm-2 s-1 Å-1, and the line flux in units of 10-14 erg cm-2 s-1. The dashed line in the blue and red continuum light-curves mark the contribution of the host galaxy starlight-continuum.
Current usage metrics show cumulative count of Article Views (full-text article views including HTML views, PDF and ePub downloads, according to the available data) and Abstracts Views on Vision4Press platform.
Data correspond to usage on the plateform after 2015. The current usage metrics is available 48-96 hours after online publication and is updated daily on week days.
Initial download of the metrics may take a while.