Fig. 10
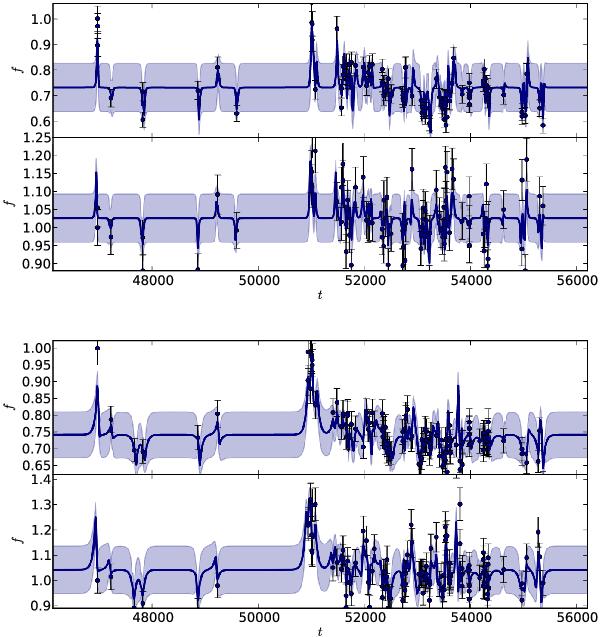
Models of the Hα (upper panel) and Hβ line (lower panel), where the upper plot gives the line light-curve and the bottom plot the continuum light-curve. In the plots the full line denotes the model of the expected mean light-curve, while dots represent the observed data. The blue band shows the expected spread of the light-curves around the mean consistent with the data. The x-axis gives the modified Julian Date (MJD), the y-axis the normalized line/continuum fluxes.
Current usage metrics show cumulative count of Article Views (full-text article views including HTML views, PDF and ePub downloads, according to the available data) and Abstracts Views on Vision4Press platform.
Data correspond to usage on the plateform after 2015. The current usage metrics is available 48-96 hours after online publication and is updated daily on week days.
Initial download of the metrics may take a while.