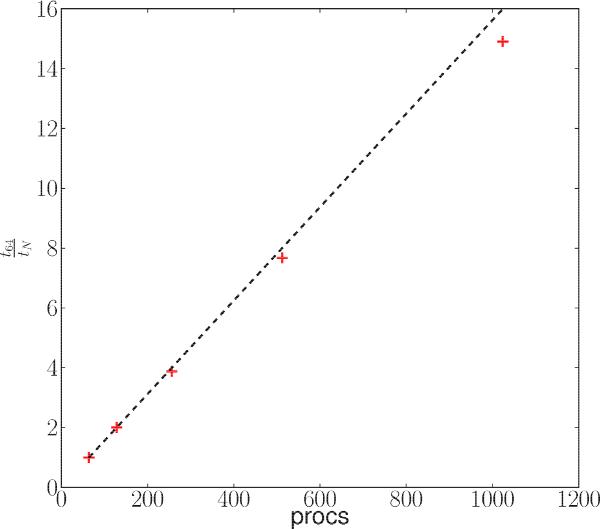
Fig. 11

Parallel scaling benchmark results for the static-accretion disk test case. We plot
here the number of processor cores against  , where
tN is the runtime used on
N processors for t64. The run times
with full hydrodynamics and radiation transport for 64, 128, 256, 512, and 1024 cpu
cores (red crosses) are shown together with the ideal case (black dashed line).
Current usage metrics show cumulative count of Article Views (full-text article views including HTML views, PDF and ePub downloads, according to the available data) and Abstracts Views on Vision4Press platform.
Data correspond to usage on the plateform after 2015. The current usage metrics is available 48-96 hours after online publication and is updated daily on week days.
Initial download of the metrics may take a while.


