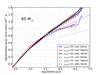
Fig. 13

Left panel: evolution of the radius of the bubble as a function of the time for various 25 M⊙ models. All models are normalised for the time of log (t [yr] ) = 4.5. The extension of the bubble at this time is about 0.75 pc, with small deviations for the different models. Right panel: same for the 60 M⊙ models. Here the extension of the bubble for the normalisation time is about 1.7 pc. Thin lines indicate slopes of 3/5, 2/5, and 1/5.

Current usage metrics show cumulative count of Article Views (full-text article views including HTML views, PDF and ePub downloads, according to the available data) and Abstracts Views on Vision4Press platform.
Data correspond to usage on the plateform after 2015. The current usage metrics is available 48-96 hours after online publication and is updated daily on week days.
Initial download of the metrics may take a while.