Free Access
Fig. 3
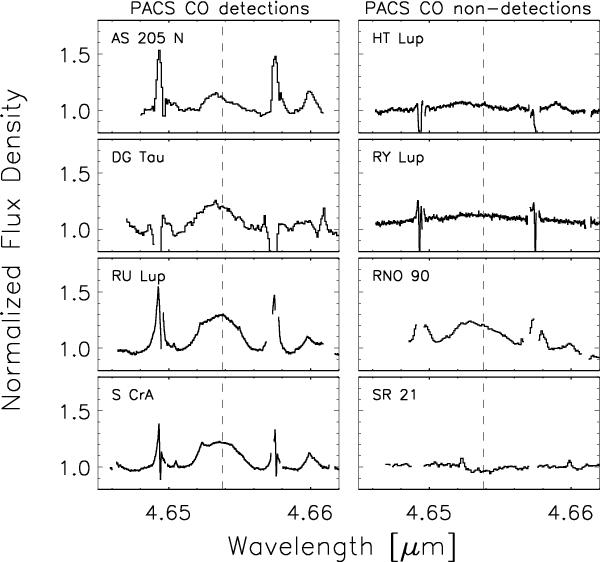
Observations of H Pfβ for the TTS sample; the line position is indicated with the vertical dashed line. Left: sources for which we have CO detections; right: sources for which CO was not detected with PACS.
Current usage metrics show cumulative count of Article Views (full-text article views including HTML views, PDF and ePub downloads, according to the available data) and Abstracts Views on Vision4Press platform.
Data correspond to usage on the plateform after 2015. The current usage metrics is available 48-96 hours after online publication and is updated daily on week days.
Initial download of the metrics may take a while.