Free Access
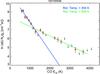
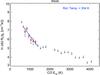
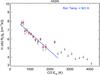
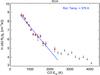
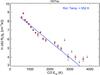
Fig. 2
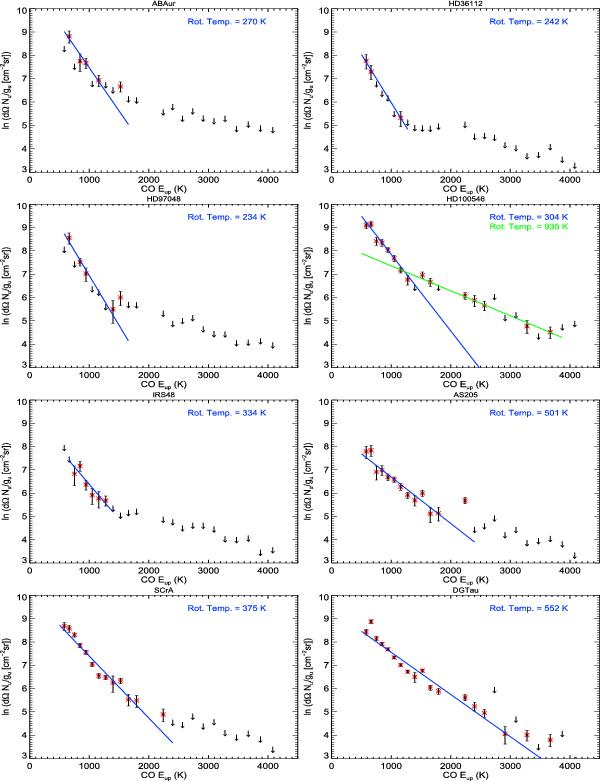
Rotational diagrams of the sources with at least 3 CO emission line detections (marked with a red asterisk, upper limits with an arrow). We also show a fit to the ladder, from which the rotational temperature can be derived.
This figure is made of several images, please see below:
Current usage metrics show cumulative count of Article Views (full-text article views including HTML views, PDF and ePub downloads, according to the available data) and Abstracts Views on Vision4Press platform.
Data correspond to usage on the plateform after 2015. The current usage metrics is available 48-96 hours after online publication and is updated daily on week days.
Initial download of the metrics may take a while.