Fig. 14
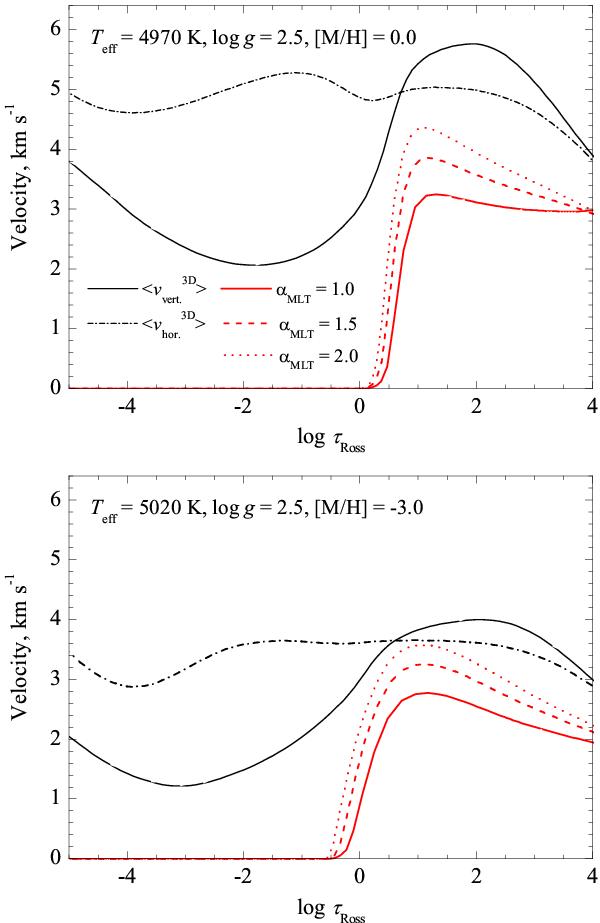
Velocity profiles of the LHD models (red/gray lines) at [M/H] = 0.0 (top panel) and [M/H] = −3.0 (bottom panel) computed using three different mixing-length parameters, αMLT = 1,1.5,2.0. Vertical and horizontal velocity profiles of the average ⟨3D⟩ model (computed on the log τRoss iso-surfaces are shown as solid and dot-dashed black lines, respectively.
Current usage metrics show cumulative count of Article Views (full-text article views including HTML views, PDF and ePub downloads, according to the available data) and Abstracts Views on Vision4Press platform.
Data correspond to usage on the plateform after 2015. The current usage metrics is available 48-96 hours after online publication and is updated daily on week days.
Initial download of the metrics may take a while.