Fig. 12
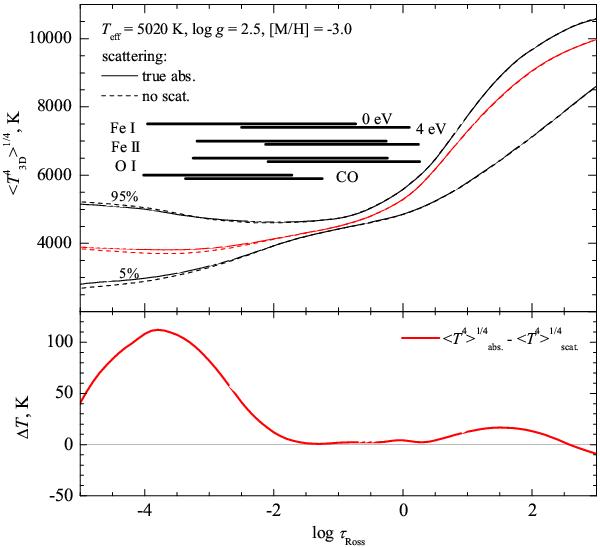
Top panel: temperature profiles of the average ⟨3D⟩ model (Teff = 5020 K, log g = 2.5, and [M/H] = −3.0) calculated with scattering treated as true absorption (red solid line) and with scattering opacity neglected at small τRoss (red dashed line). Black lines mark the 5th and 95th percentiles of the temperature distribution in the 3D model with scattering treated as true absorption (solid lines) and scattering opacity neglected in optically thin regions (dashed lines). Horizontal bars indicate the approximate location where lines of several trace elements form at λ = 400 nm and χ = 0 and 4 eV and of the CO molecule at λ = 400 nm and χ = 0 and 3 eV (bars mark the regions where the equivalent width, W, of a given spectral line grows from 5% to 95% of its final value). Bottom panel: difference in the temperature profiles corresponding to the average ⟨3D⟩ models calculated with the two different treatments of scattering.
Current usage metrics show cumulative count of Article Views (full-text article views including HTML views, PDF and ePub downloads, according to the available data) and Abstracts Views on Vision4Press platform.
Data correspond to usage on the plateform after 2015. The current usage metrics is available 48-96 hours after online publication and is updated daily on week days.
Initial download of the metrics may take a while.