Fig. 1
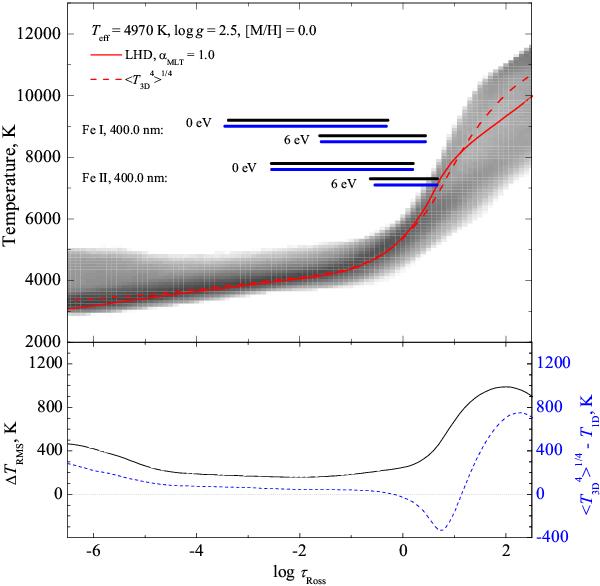
Upper panel: temperature profiles in the red giant model with Teff/log g/ [M/H] = 4970/2.5/0.0, plotted versus the Rosseland optical depth, τRoss, and shown for the following model atmospheres: 3D (density plot), ⟨3D⟩ (dashed line), and 1D (solid line). Horizontal bars mark the approximate location of the Fe I and Fe II line formation regions in the 3D (black) and 1D (blue) atmosphere models, at λ = 400 nm and χ = 0 and 6 eV (bars mark the regions where the equivalent width, W, of a given spectral line grows from 5% to 95% of its final value). Lower panel: rms horizontal temperature fluctuations in the 3D model (solid line), and difference between the temperature profiles of the ⟨3D⟩ and 1D models (dashed line), shown as functions of the Rosseland optical depth. In both panels, all quantities related to the 3D and ⟨3D⟩ models were obtained using the subset of twenty 3D model snapshots utilized in the 3D spectral line synthesis calculations (see Sect. 2.1).
Current usage metrics show cumulative count of Article Views (full-text article views including HTML views, PDF and ePub downloads, according to the available data) and Abstracts Views on Vision4Press platform.
Data correspond to usage on the plateform after 2015. The current usage metrics is available 48-96 hours after online publication and is updated daily on week days.
Initial download of the metrics may take a while.