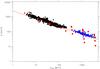
Fig. 5
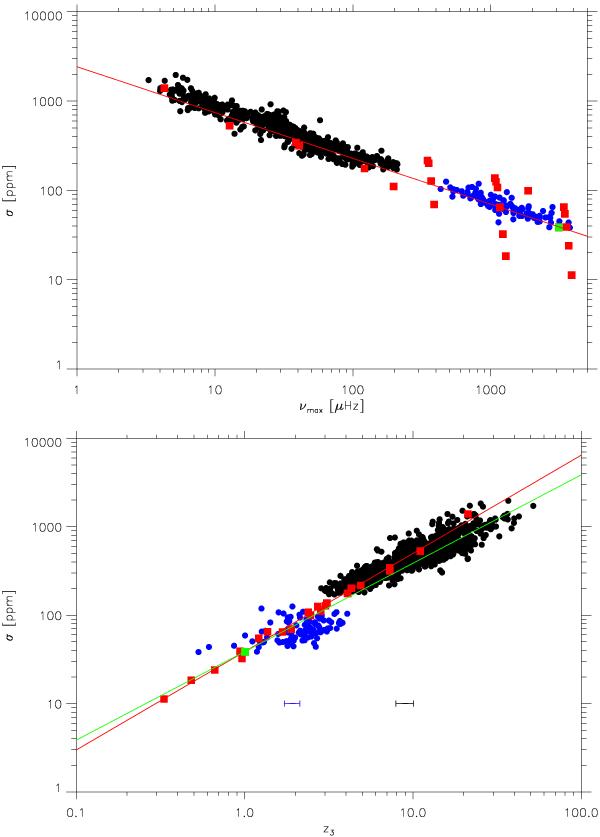
Top: root-mean-square brightness fluctuation σ as a function of νmax. The symbols have the same meaning as in Fig. 1. The red curve is a power law of the form  with the slope p = −0.51 obtained by fitting the power law to the theoretical values of σ (filled red squares). The filled green square corresponds to the value σ = 39 ppm found for the solar 3D model. Bottom: σ as a function of the quantity z3 given by Eq. (19) where ℳa and
  are here supposed to scale according to Eq. (17) and Eq. (22), respectively. The green line corresponds to a linear scaling with z3 and the red one to a power law of the form
  where p = 1.11.
Current usage metrics show cumulative count of Article Views (full-text article views including HTML views, PDF and ePub downloads, according to the available data) and Abstracts Views on Vision4Press platform.
Data correspond to usage on the plateform after 2015. The current usage metrics is available 48-96 hours after online publication and is updated daily on week days.
Initial download of the metrics may take a while.