Fig. 7
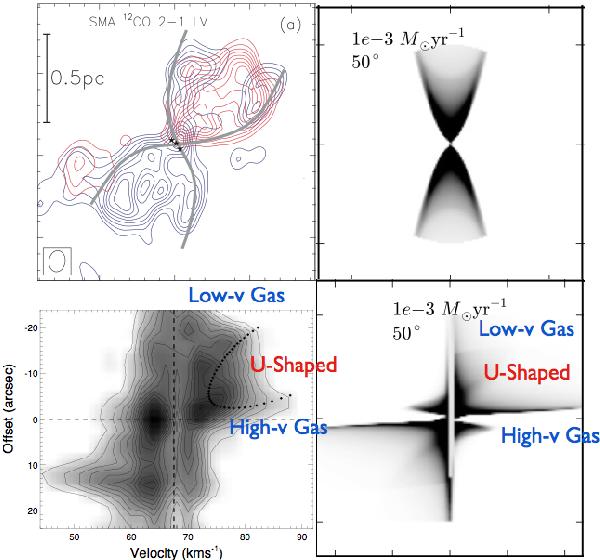
Comparison between the observations by Qiu et al. (2009) and the predictions from our wind-driven turbulent entrainment model. The upper left panel shows the morphology of the outflow observed by Qiu et al. (2009), the lower left panel shows the position-velocity structure of the observed outflow. The upper right panel shows the morphology of the outflow from our modelling, the lower middle panel shows the position-velocity structure of our outflow model cut along its major axis. The outflow model has a mass-loss rate of 1.0 × 10⁻³ M⊙yr-1 and an inclination angle of 50°. For both the observations (lower left panel) and our modelling (lower right panel), the U-shaped region is the region in the position-velocity diagram where the structure of the outflow exhibits a U shape, the Low-v gas region is the region where the gas has a relative small velocity at regions far from the protostar, and the High-v gas region is the region where the gas has a relatively high velocity in the close vicinity to the protostar.
Current usage metrics show cumulative count of Article Views (full-text article views including HTML views, PDF and ePub downloads, according to the available data) and Abstracts Views on Vision4Press platform.
Data correspond to usage on the plateform after 2015. The current usage metrics is available 48-96 hours after online publication and is updated daily on week days.
Initial download of the metrics may take a while.