Fig. 7
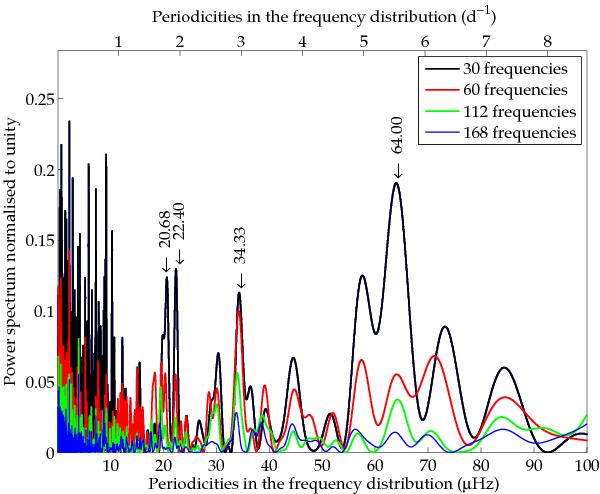
Fourier transform of various subsets selected by amplitude. The blue, green, red, and cyan lines correspond to the FT calculated from the subset including the first 30, 60, 112, and 168 (all the peaks except the close ones) highest amplitude frequencies, respectively. The peaks corresponding to the large separation (64 μHz) and its sub-multiples are labelled (see text).
Current usage metrics show cumulative count of Article Views (full-text article views including HTML views, PDF and ePub downloads, according to the available data) and Abstracts Views on Vision4Press platform.
Data correspond to usage on the plateform after 2015. The current usage metrics is available 48-96 hours after online publication and is updated daily on week days.
Initial download of the metrics may take a while.